Will they or won’t they?

With the big meeting between the US and China presidents on Saturday it would seem that anything is possible by Monday morning. Will they or won’t they? The hope of a deal seems to remain remarkable high as the bulls once again show strength in the morning futures. Asian markets closed lower across the board overnight but European markets are all cautiously higher ahead of the G20.
Even the beleaguered IWM managed to join the DIA, SPY and QQQ yesterday by closing just above its 50-day average. Although the futures suggest a modest gap up this morning we must be very careful and thoughtful of the potential risk of this weekend. I don’t know about anyone else but I will avoid adding additional risk ahead of this weekend and will likely reduce my current holdings to protect my capital from the unknown.

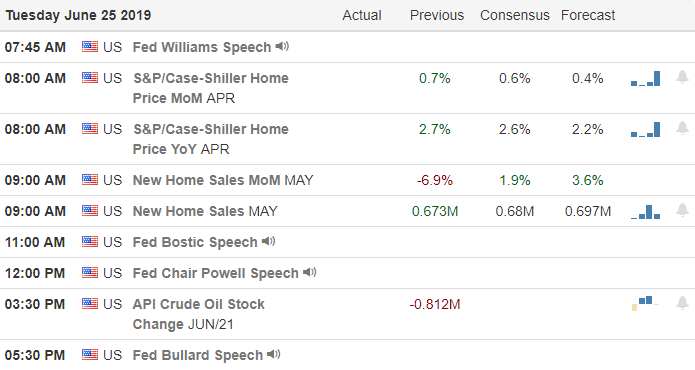
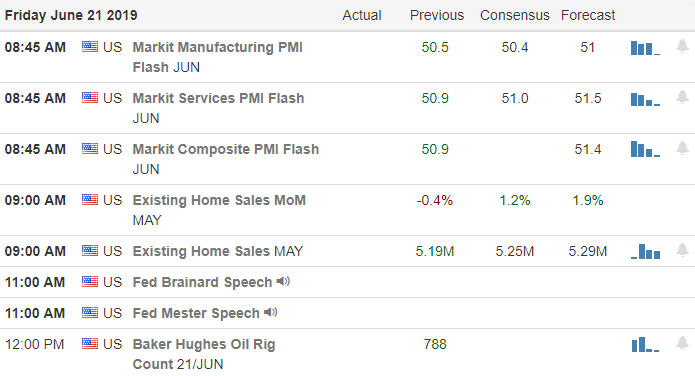
On the Calendar
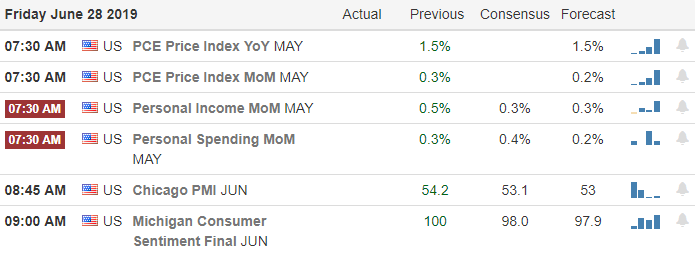
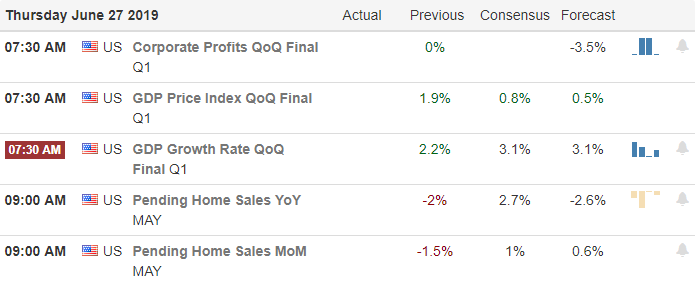
On the Friday Earnings calendar we only have 13 companies reporting their results. Among the notable are STZ & KHC.
Action Plan
The bulls remain very tenacious this morning even after learning that next quarter earnings are expected to flat. One must wonder how we can remain near all-time highs without earnings growth. Possible rate cuts will certainly help and of course a trade deal with China would be a game changer but those are still some big unknowns. It seems a lot would have to go exactly right which makes me wonder if we’re coming close to pricing the market to perfection. Only time will tell.

Technically speaking the current trend is up and the bulls are in control with the Futures pointing to a bullish open. Remember the potential market volatility in reaction to the G20 meeting results after the president meets to discuss trade relations with China. Plan your risk carefully heading into the weekend keeping in mind the holiday week that follows. Have a wonderful weekend everyone!
Trade Wisely,
Doug