Disappointment

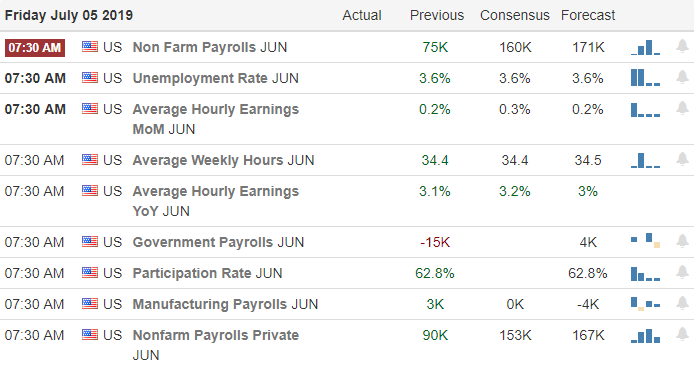
The market is showing a face of disappointment this morning as it would appear to favor an accommodating FOMC rather than strong jobs growth. Asian markets closed lower across the board overnight in reaction the better than expected US Jobs growth. European markets are currently mixed but mostly lower as Deutsche Bank announces huge job losses as it restructures the business.
US futures point to a modestly lower open this morning recovering significantly from overnight lows as we approach the days open. Light economic and earnings calendars will provide very little for the market to react to this morning. Considering the kick off the earnings season is just one week away, and the current rally appears a bit stretched, a little consolidating price action might be in order. I would also not rule out a test of the overnight futures low.

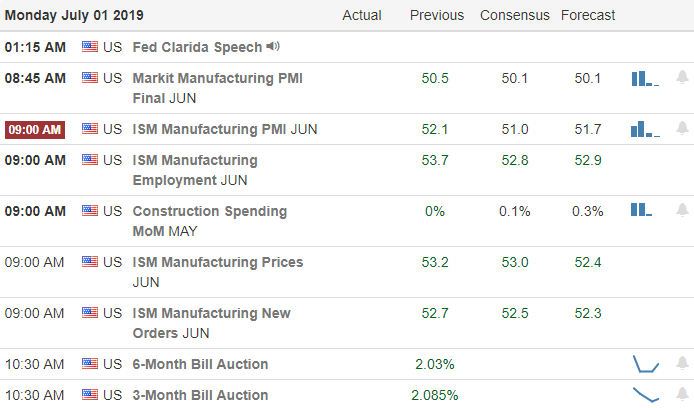
On the Calendar
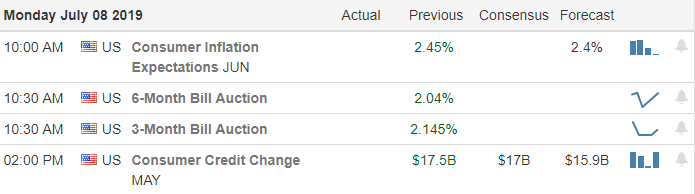
We begin the new trading week with a light day on the Earnings Calendar that includes only six reports. Of those reporting, none are notable and likely to move the market.
Action Plan
Markets appear a little disappointed this morning that the US economy is strong, jobs growth is better than expected and the chance that an FOMC rate cut has diminished. Although the strong jobs number initially triggered some selling on Friday, the Bulls still found the energy to fight back closing just below record highs. The question is, can the Bulls do it again today or will the Bears show some teeth?

With earnings season set to begin in next week, it could be rather quiet and choppy, consolidating the rally as we wait for the big banks to start the festivities. Speaking of big banks, Deutsche Bank (DB) announced a major restructuring Sunday that will cut between 18 to 20 thousand jobs in an effort to return to profitability. Shares are looking only slightly lower this morning. Strong trends remain in place for the DIA, SPY, and QQQ and though the rally may be a bit extended don’t expect the Bulls to give up easily.
Trade Wisely,
Doug