Earnings Rev Up the Bulls
Tuesday was a strong day from the start on the back of good earnings reports from major banks. However, after a solid gap and run at the Open, the Bulls seemed to hit a wall about 11 am. The rest of the day was a grind sideways with the close at the low end of the 11 am 15min candle. This action left us with a Bullish Trader’s Best Friend signal (albeit less than optimal with an upper wick). It certainly appears that the Bulls want to at least retest the all-time highs again.
In International news, there was European fear on news of stalled Brexit negotiations. This comes less than 24hr after optimism for a new deal. However, nothing will be sure until Thursday night (EU Leader dinner where a new Brexit deal will be debated). Even then, it is unsure if any new deal could be passed by the UK Parliament in its emergency Saturday session.

Overnight, Asian markets were mixed, but mostly higher. European markets are also mixed. As of 7:30 am, U.S. futures were all pointing to mostly flat open, looking for a gap down of only 0.10%.
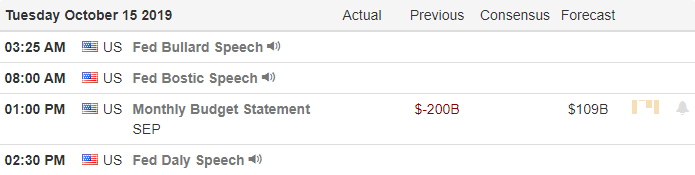
Today’s economic calendar includes Retail Sales (8:30 am) and Oil Inventories (10:30 am). However, once again earnings are likely to drive action with ABT, BAC, PNC and USB reporting before the open. (BAC already reported, posting higher the expected results.) CSX, CCI, IBM, KMI, NFLX and URO report after the Wed. Close.

Remember to be careful chasing gaps. The downtrend has been broken, but this market remains very volatile and looking for the next news items on which to over-react.
Ed
For Your Consideration: Trade ideas for your swing trading watchlist. Short – EL, SHAK, LDOS, SBUX, YUM – Long – JBL, AMAT, MPC, DLTR, KBH, INFO, DE, LEN, SYY, KLAC Trade smart, take profits along the way and trade your trade. Stocks we mention and talk about are not recommendations to buy or sell.
✅ SMS text alerts and reminders?👈
✅ Check out our newest YouTube videos👈
🎯 Mike Probst: Rick, Got CTL off the scanner today. Already up 30%. Love it.
🎯 Dick Carp: the scanner paid for the year with HES-thank you
🎯 Arnoldo Bolanos: LTA scanner really works $$, thanks Ed.
🎯 Bob S: LTA is incredible…. I use it … would not trade without it
🎯 Malcolm .: Posted in room 2, @Rick… I used the LTA Scanner to go through hundreds of stocks this weekend and picked out three to trade: PYPL, TGT, and ZS. Quality patterns and with my trading, up 24%, 7% and 12%…. this program is gold.
🎯 Friday 6/21/19 (10:09 am) Aaron B: Today, my account is at +190% since January. Thanks, RWO HRC Flash Malcolm Thomas Steve Ed Bob S Bob C Mike P and everyone that contributes every day. I love our job.
Disclosure: We do not act on all trades we mention, and not all mentions acted on the day of the mention. All trades we mention are for your consideration only.


Free YouTube Education • Subscription Plans • Private 2-Hour Coaching
DISCLAIMER: Investing / Trading involves significant financial risk and is not suitable for everyone. No communication from Hit and Run Candlesticks Inc, its affiliates or representatives is not financial or trading advice. All information provided by Hit and Run Candlesticks Inc, its affiliates and representatives are intended for educational purposes only. You are advised to test any new trading approach before implementing it. Past performance does not guarantee future results. Terms of Service