Trading Problems / Solutions


The question of a new record high received an affirmative answer yesterday as both the SPY and QQQ finally broke through the stubborn resistance level. However, before we can officially claim victory and sound the all-clear signal, they must now prove they can hold this new level as support. Earnings disappointments after the bell yesterday have the US Futures looking a bit pensive this morning as we face more than 250 new reports today. The bulls are clearly in control but stay flexible and focused on price action because sentiment can change with such a barrage of data.
Overnight, Asian markets closed mixed but mostly lower, and the European markets this morning currently are flat to mostly lower as they monitor earnings and the pending UK Brexit related election. US Futures trade mixed this morning with Dow pointing to bearish open that seems to be getting heavier as the morning progress, but that could quickly change though out the morning depending on earning results.
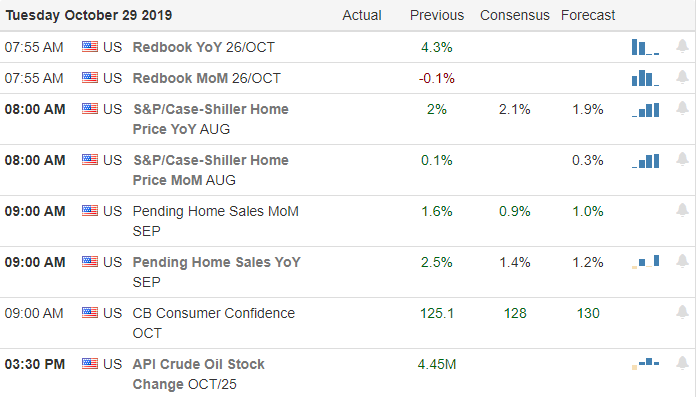
Tuesday’s Economic Calendar indicates more than 250 companies will report results today. Notable reports include AMD, ALL, AMGN, AOS, AN, BIDU, SAM, BP, CAKE, CB, COP, GLW, CMI, DENN, DLR, ECL, EA, EPR, EXR, FEYE, GM, GRUB, HCA, HLF, IR, K, KKR, LDOS, MA, MAT, MRK, MDLZ, PAYC, PFE, PSA, SPGI, SHOP, SYK, WH, XRX, YUMC, & EXN.
Yesterday the SPY and QQQ finally found the inspiration to break out while the DIA continues to struggle with price resistance. Breaking out is only one step in the equation; now, they must prove it can hold the new lofty prices as support. As we wait for the FOMC interest rate decision, we have another big day of earnings reports to digest as well as the Case-Shiller Report, Consumer Confidence, and Pending Home Sales. Price volatility is likely during the early session, but it could significantly slow after the morning rush as we wait on the FOMC.
Technically Speaking, the Bulls are in control with all four of the major indexes holding above their 50-day averages. However, with earnings misses after the bell such as GOOGL, the Futures seem a bit pensive this morning ahead of a fresh round of reports. As I am writing this report the Futures are mixed with the Dow suggesting a slightly lower open. That, of course, can quickly change for the better or worse as the morning earning reports roll out in quick succession. T2122 suggests there is still room to move higher, although beginning to look a bit extended as the VIX tests a 12 handle.
Trade Wisely,
Doug
Monday saw a strong gap higher as both T and WBA beat during the premarket and the attraction of all-time highs proved irresistible. The President had also tweeted that Trade War Negotiations were ahead of schedule (whatever that means). Regardless of the drivers, the SPY and QQQ both ended the day at new all-time high closes. The IWM also broke out of its recent resistance level and the DIA lagged, staying within its two-week range despite the gap-up.
The Tuesday economic calendar includes Conf. Board Consumer Confidence and Sept. Pending Home Sales (both at 10 am). The FOMC also begins its two-day meeting (with the market “pricing in” a rate cut on Wed.). However, earnings are likely to steal the show again today, with GOOG (miss) and TMUS (beat) having reported after the bell Monday. Among the pre-market reporters on Tuesday are COP, GLW, CMI, ETN, ECL, GM, IR, K, MLM, MRK, PFE, and XRX. (COP, MRK, PFE, and K all reported beats this am. GM missed and lowered on strike effects.)

Overnight, Asian markets were mixed, with China showing red. In Europe, red was the color of the day across the board so far. As of 7:30 am, U.S. futures were indicating a gap down of 0.1% in the DIA, 0.2% in the SPY and 0.3% in the QQQ.

With the Fed show back in town, reduced rhetoric on the China Trade War front and generally good earnings reports, the Bulls are feeling no pain. However, each of those 3 factors could be a double-edged sword. If the Fed doesn’t do as expected (or just says the wrong thing), or we have a new flare-up in US-China threats, or we catch a couple of missed earnings (or bad guidance) from major names…things could change in a heartbeat. Don’t be surprised by lighter volumes and a more “wait and see” attitude in the market Tuesday. The bulls are running, but be cautious, and remember to take profits along the way.
Ed
Swing-Trade Trade ideas for your consideration. Long – PM, CNC, AFL, TSM, JBHT, PNC, DG, JEC, AMAT, BERY, JWN, KSS. Short – CINF, NOC, KO, CSX, TTWO, MDT. Trade smart, take profits along the way and trade your trade. Also, do not forget to check for upcoming earnings. Stocks we mention and talk about are not recommendations to buy or sell.
🎯 Mike Probst: Rick, Got CTL off the scanner today. Already up 30%. Love it.
🎯 Dick Carp: the scanner paid for the year with HES-thank you
🎯 Arnoldo Bolanos: LTA scanner really works $$, thanks Ed.
🎯 Bob S: LTA is incredible…. I use it … would not trade without it
🎯 Malcolm .: Posted in room 2, @Rick… I used the LTA Scanner to go through hundreds of stocks this weekend and picked out three to trade: PYPL, TGT, and ZS. Quality patterns and with my trading, up 24%, 7% and 12%…. this program is gold.
🎯 Friday 6/21/19 (10:09 am) Aaron B: Today, my account is at +190% since January. Thanks, RWO HRC Flash Malcolm Thomas Steve Ed Bob S Bob C Mike P and everyone that contributes every day. I love our job.
Disclosure: We do not act on all trades we mention, and not all mentions acted on the day of the mention. All trades we mention are for your consideration only.
Free YouTube Education • Subscription Plans • Private 2-Hour Coaching
DISCLAIMER: Investing / Trading involves significant financial risk and is not suitable for everyone. No communication from Hit and Run Candlesticks Inc, its affiliates or representatives is not financial or trading advice. All information provided by Hit and Run Candlesticks Inc, its affiliates and representatives are intended for educational purposes only. You are advised to test any new trading approach before implementing it. Past performance does not guarantee future results. Terms of Service


A busy economic calendar and about 900 companies reporting earnings will give the market a fire hose of data to digest this week. Wednesday afternoon, the FOMC is expected to cut the interest rate for the 3rd time this year, and we’ll cap the week with the Employment Situation and ISM reports. Indeed a very busy week as the market knocks on the door of record highs.
Asian markets closed the day green across the board on US-China trade optimism. European markets are mixed but mostly higher this morning as the EU grants an extension to January 31 for Brexit. US Futures are bullish this morning and may create new record highs in SPY, and the QQQ at the open assuming earnings reports and the International Trade in Goods report don’t change the current sentiment. Buckle up; it could be a wild ride this week!

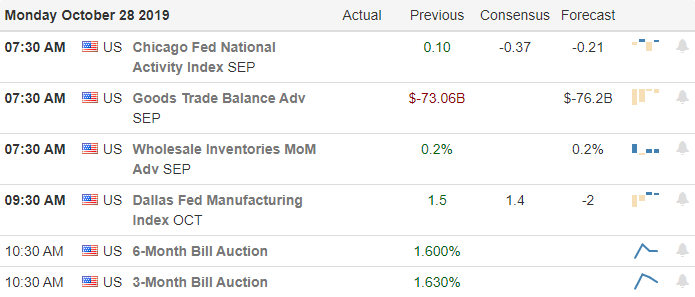
The Monday Earnings Calendar had just short of 140 companies reporting quarterly results. Notable reports include AKAM. GOOGL, T, AVB, BYND, CTB, EPD, LEG, L, NXPI, ON, QSR, SPOT, TXRH, TMUS, RIG, VNO, WBA, and WELL.

We had a nice weekend where there were no additional uncertainties, and in fact had a few resolutions. First, according to reports, some provisions of the Phase 1 trade agreement are coming together. The report was very thin on details but enough to move the market substantially toward record highs. The Yield curve that shook the market a few months ago is improving, and the FOMC is expected to lower the interest rate for the 3rd time on Wednesday afternoon. GM reached an agreement with striking workers, and the ISIS leader Baghdadi met his end this weekend improving the US relationship with Syria.

US Futures, suggest a bullish open that may print all-time highs in the SPY at the QQQ, at the time of writing this report. Although the DIA is lagging behind, the bullish engulfing candle popping out of a consolidation rage on Friday suggests a break of the current downtrend is possible with the futures suggesting a gap up of about 70 points at the open. Of course with a big round of earnings reports, this morning and the International Trade in Goods report at 8:30 AM Eastern anything is possible. We have a very big week of economic data, so keep in mind price action could become very light and choppy as we wait.
Trade Wisely,
Doug
Overall, markets are giddy to be at or near the all-time highs again. However, there is also some fear from recent misses and uncertainty with the FOMC meeting just a couple of days ahead. Earnings and FOMC should be the lead stories with another heavy reporting list again this week and the Fed meeting on Tuesday and Wednesday. On Monday, among the major names reporting before the Open are: T, CHKP, DTE, L, NLSN, and WBA. The major economic news is limited to Sept. Trade Balance and Sept. Retail Inventories (both at 8:30 am).
Friday saw a rally with the QQQ closing at all-time highs and the SPY testing all-time high resistance. The DIA and IWM both printed a Bullish Engulfing Signals, with the DAI bouncing up off the recent support level again and the IWM testing its resistance again as well.

The EU has decided on giving the UK a 3-month extension, (France folded from its support of Boris Johnson where they were pushing for an extension of only a few days.) However, as a middle-ground, Brexit can happen before January 31…if the UK can get their act together to be ready early.

Overnight, Asian and European markets were green and European markets are mixed, but mostly green. As of 7:30 am, U.S. futures were indicating a gap up of 0.3% in the SPY, 0.5% in the QQQ and the DIA lagging with a gap-up of 0.2%.
Bulls are thrilled to be at the highs again. However, with many more earnings and the FOMC still ahead of us, don’t be surprised by lighter volumes and we see a slow market Monday. Be cautious, and remember to take profits along the way.
Ed
Trade ideas for your consideration. Long – KSS, HOME, PM, CNC, PNC, TSM, JBHT, AFL, COG, BERY, SNBR, JEC, JWN. Short – CINF, GD, KO, NOC. Trade smart, take profits along the way and trade your trade. Also, do not forget to check for upcoming earnings. Stocks we mention and talk about are not recommendations to buy or sell.
🎯 Mike Probst: Rick, Got CTL off the scanner today. Already up 30%. Love it.
🎯 Dick Carp: the scanner paid for the year with HES-thank you
🎯 Arnoldo Bolanos: LTA scanner really works $$, thanks Ed.
🎯 Bob S: LTA is incredible…. I use it … would not trade without it
🎯 Malcolm .: Posted in room 2, @Rick… I used the LTA Scanner to go through hundreds of stocks this weekend and picked out three to trade: PYPL, TGT, and ZS. Quality patterns and with my trading, up 24%, 7% and 12%…. this program is gold.
🎯 Friday 6/21/19 (10:09 am) Aaron B: Today, my account is at +190% since January. Thanks, RWO HRC Flash Malcolm Thomas Steve Ed Bob S Bob C Mike P and everyone that contributes every day. I love our job.
Disclosure: We do not act on all trades we mention, and not all mentions acted on the day of the mention. All trades we mention are for your consideration only.
Free YouTube Education • Subscription Plans • Private 2-Hour Coaching
DISCLAIMER: Investing / Trading involves significant financial risk and is not suitable for everyone. No communication from Hit and Run Candlesticks Inc, its affiliates or representatives is not financial or trading advice. All information provided by Hit and Run Candlesticks Inc, its affiliates and representatives are intended for educational purposes only. You are advised to test any new trading approach before implementing it. Past performance does not guarantee future results. Terms of Service



With a mixed bag of earnings results, the overall market continues to struggle with the overhead resistance of all-time highs. After receiving another late-day rally yesterday, the bulls have the upper hand but lack the inspiration to push forward with confidence. With a lighter Friday earnings calendar and the big disappointment report by AMZN, the bulls and bears seem equally matched as we head into the weekend.
Asian markets closed mixed with the uncertainties of trade and Brexit still hanging overhead. European markets also trade mixed this morning due to the mixed bag of earnings results and a possible Brexit vote ahead. US Futures currently appear to lack in energy this morning, dancing around the flat line ahead of fresh reports and a Consumer Sentiment report at 10 AM Eastern.

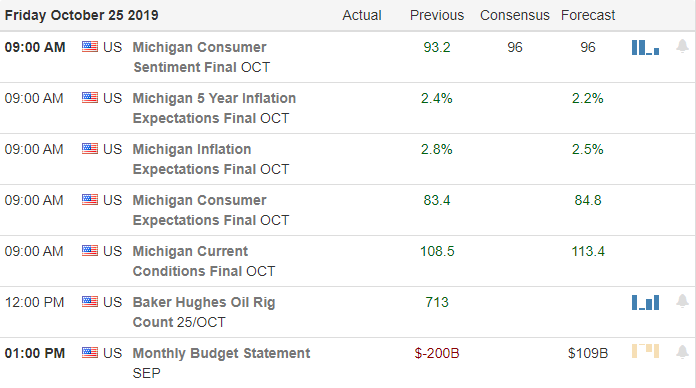
We have a lighter day on the Earnings Calendar this Friday, with just over 63 companies expected to report. Notable reports include BUD, CHTR, GT, ITW, LEA, PSX, PSXP, VFC, VTR, VZ, WY, WETF, AND YNDX.

US markets struggled yesterday with the DIA under pressure ending the day with mixed results. This morning US Futures this morning recovered from some overnight losses but also seem a bit confused hovering around the flat line. Vice President Pence delivered an address with harsh words directed at China on trade and human rights practices. He also delivered some scathing criticism of the actions of NKE and the NBA organization regarding the Hong Kong protesters. Trade negotiators are scheduled to speak by phone next Friday.

With another late-day rally yesterday, the bull continues to hold a stronger hand and continues to focus on the all-time high resistance levels above that have proven to very challenging to breach. While companies such as INTC and JNPR produced better than expected earnings results, AMZN delivered a big disappointment. As we head into the weekend with such a mixed bag of earnings results, Friday trading has the potential to produce another choppy day of price action.
Trade Wisely,
Doug
Thursday saw a gap-up in all 4 major indices, but that was met will an immediate sell-off the first hour across the board. A couple more waves of rally and sell-off left us in the red in 3 of the 4 indices, with only the QQQ remaining positive by mid-afternoon. However, the day ended on a 2-hour rally across the board. For the day, we printed a Spinning Top in the SPY. The DIA and IWM gave us Bearish Engulfing signals, while the QQQ printed a gap-up Hanging Man type candle. In terms of Support and Resistance, the IWM failed its level again with the SPY, DIA and QQQ all remaining range-bound.
As expected, earnings continue to be the leading story. The same should be true Friday, with a miss by AMZN and a beat by INTC after-hours Thursday. Those reporting before the bell Friday include CHTR, ITW, PSX, VFC, VZ, and WY among the major names. Major economic news for Friday is limited to Michigan Consumer Sentiment (10 am) and the Baker-Hughes Rig Count (1 pm).

There was no “new news” on the Brexit overnight. The EU is still deferring a decision on granting an extension until they see what happens next in the UK. Meanwhile, the UK Parliament won’t grant the PM’s desired new election until “No Deal” Brexit is taken off the table…which would mean an extension being in place. On the China Trade War front, no new news was reported last night.

Overnight, Asian and European markets were both mixed. As of 7:30 am, U.S. futures were in the same shape with the DIA on the green side of flat, the SPY on the red side of flat and the QQQ indicating a gap down of 0.4%.

I know it is repetitive, but remember to be careful chasing. If earnings remain strong, this should be a bullish market. However, in recent months trading has been very news-driven. So, be sure to use caution, take profits along the way and trade your plans. This is especially true on a Friday when there are 2.5 days of potential news ahead of us before we can respond in our trading.
Ed
Sorry, but no Trade ideas for Friday. Remember that it’s payday…time to pay yourself. Trade smart, take profits along the way and trade your trade. Also, do not forget to check for upcoming earnings. Stocks we mention and talk about are not recommendations to buy or sell.
🎯 Mike Probst: Rick, Got CTL off the scanner today. Already up 30%. Love it.
🎯 Dick Carp: the scanner paid for the year with HES-thank you
🎯 Arnoldo Bolanos: LTA scanner really works $$, thanks Ed.
🎯 Bob S: LTA is incredible…. I use it … would not trade without it
🎯 Malcolm .: Posted in room 2, @Rick… I used the LTA Scanner to go through hundreds of stocks this weekend and picked out three to trade: PYPL, TGT, and ZS. Quality patterns and with my trading, up 24%, 7% and 12%…. this program is gold.
🎯 Friday 6/21/19 (10:09 am) Aaron B: Today, my account is at +190% since January. Thanks, RWO HRC Flash Malcolm Thomas Steve Ed Bob S Bob C Mike P and everyone that contributes every day. I love our job.
Disclosure: We do not act on all trades we mention, and not all mentions acted on the day of the mention. All trades we mention are for your consideration only.
Free YouTube Education • Subscription Plans • Private 2-Hour Coaching
DISCLAIMER: Investing / Trading involves significant financial risk and is not suitable for everyone. No communication from Hit and Run Candlesticks Inc, its affiliates or representatives is not financial or trading advice. All information provided by Hit and Run Candlesticks Inc, its affiliates and representatives are intended for educational purposes only. You are advised to test any new trading approach before implementing it. Past performance does not guarantee future results. Terms of Service