
What’s that on your neck? No, not your actual neck! The neck on your candlestick chart. The oddly named On Neck candlestick pattern, sometimes known as the On Neckline, is a two-candle pattern that appears after a downtrend. A bearish (black) candle is followed by a bullish (white) candle, and the close price of the second candle is very near to the close of the first. I suppose in this metaphor, the neckline is the close of the first candle, which the second candle almost hits with its close, but I’m open to interpretation. What do you think? Is the entire candle the neck? In any case, to learn more about this bearish continuation signal, today we’re exploring the formation and meaning of the On Neck candlestick pattern.
On Neck Candlestick Pattern
Formation
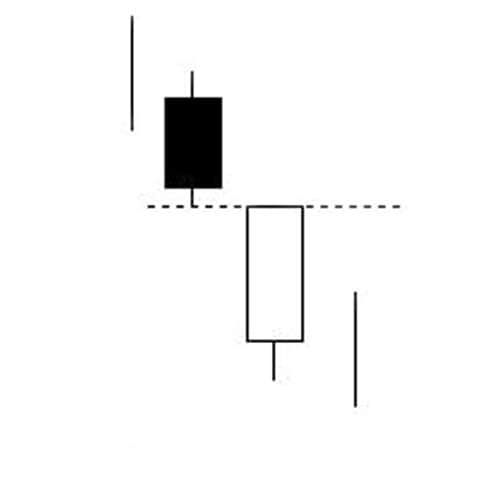
As we mentioned above, the On Neck candlestick pattern is formed by two candles. It is small and simple and, accordingly, easy to spot. To confirm your sighting of the On Neck signal, look for the following criteria:
First, a downtrend must be in progress. Second, a tall black (bearish) candle must appear. Third, a smaller white (bullish) candle must follow the black candle. Fourth and finally, the close of the white candle should nearly match the prior candle’s low. It cannot rise higher than the black candle’s low price.
A similar signal is the In Neck candlestick pattern, which is another bearish neck line pattern that indicates a continuation of the current trend. Unlike the On Neck, the In Neck’s second candle closes slightly higher than the first day’s closing. It is not as reliable as the On Neck, so be sure not to confuse these two very similar patterns.
Meaning
The bears are in control of the market, and they continue their reign with the On Neck candlestick pattern. The first candle is bearish, continuing the downward trend, and although the next candle is bullish, it opens and closes beneath the first candle. This movement suggests a continuation of the downtrend, so it is recommended that you stay on your current course. Although On Neck patterns are not particularly influential, especially in the long term, additional information is always useful when interpreting a Japanese candlestick chart.
____
To confirm the On Neck pattern, look for a black candlestick on the third day, continuing the downward trend. A long body shows strength, as does a gap between the second and third day. Because this is a continuation pattern and it likely won’t change your plan of action, you don’t necessarily need to wait around for confirmation. However, spotting it will provide you with additional assurance. Good luck!
If you’re interested in mastering some simple but effective swing trading strategies, check out Hit & Run Candlesticks. Our methods are simple, yet powerful. We look for stocks positioned to make an unusually large percentage move, using high percentage profit patterns as well as powerful Japanese Candlesticks. Our services include coaching with experienced swing traders, training clinics, and daily trading ideas. To sign up for a membership, please click here.


Comments are closed.