As any trader knows, the market can change at a moment’s notice—or without any notice at all! Just when a downtrend becomes familiar, for example, the bulls might take the reins and thrust the price upward again. To predict these occurrences, you can keep an eye out for Japanese candlestick bullish reversal patterns. Some are complex, while others are exceedingly simple. Some are reliable, while others are capricious and might slip through your fingers. To get a firm handle on the market, review the Japanese candlestick bullish reversal patterns below and add them to your repertoire.

Japanese Candlestick Bullish Reversal Patterns
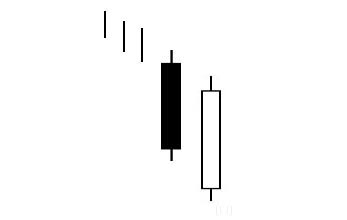
The Bullish Piercing pattern appears after a downtrend. Although the tone has been bearish and fear is spreading, the bulls jump in and turn the price around dramatically. The close of the second day is above the midpoint of the previous day, bringing the price back up from its steep decline.
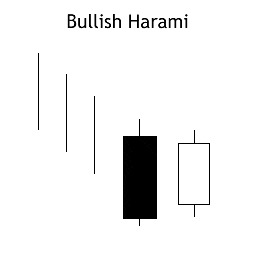
The Bullish Harami conveys a continuing downtrend, which is reversed by the bears’ intrusion. The second day opens above the previous day’s close, with the bulls now presiding over the market.
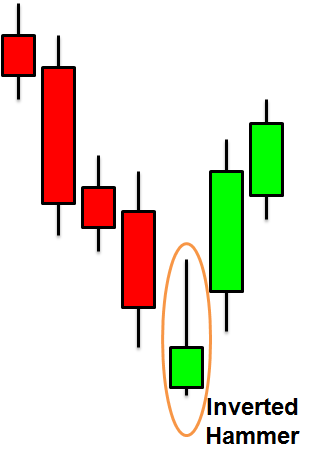
Bullish Inverted Hammer Pattern
When the Bullish Inverted Hammer gaps down at the open, it appears that the downtrend is set to continue. However, the bulls rally and bring the price up briefly. Although the day closes near to where it opened, an uptrend is expected to follow.
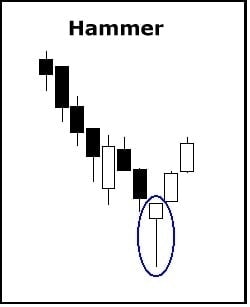
If you flip the Inverted Hammer, you’ll have the Bullish Hammer pattern. The signal consists of a downtrend pushed quite low by the bears (creating a long shadow) and a reversal by the bulls (creating a small body, because the open and close are near to each other).
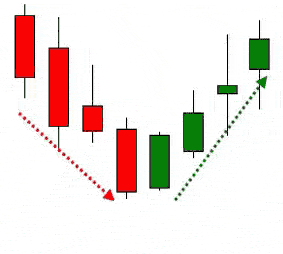
The Bullish Hook Reversal features a dipping price, which is pushed lower and lower until, at the short-term low of the trend, a reversal occurs. The next candle is green, with a higher low and a lower high than the candle preceding it. The bulls have gained momentum, and an uptrend forms.
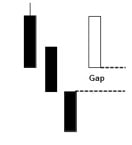
The Bullish Kicker is amongst the strongest and most influential candlestick patterns around. A major event causes the second candle to gap up after a downtrend. The price then bursts upward, conveying a strong change in investor sentiment.
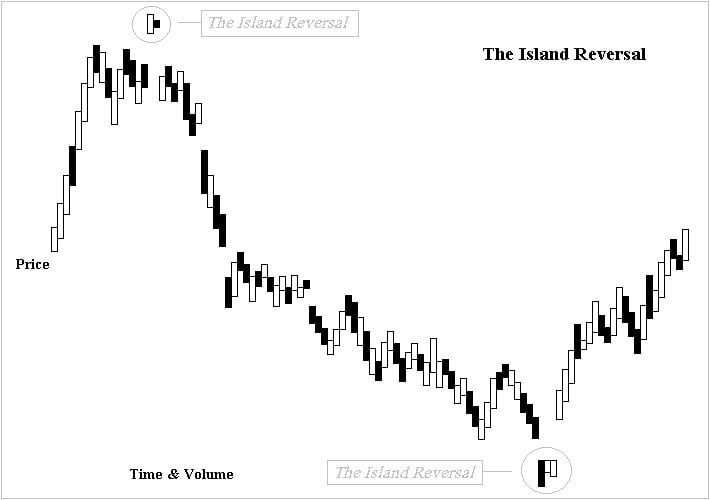
Rare but interesting, the Bullish Island Reversal occurs after the bears have been in control for some time. They cause a downward gap and the price remains low for a day or so, but then a shift occurs. The price skyrockets upward, creating a gap up. These sudden and significant changes create an island-like formation.
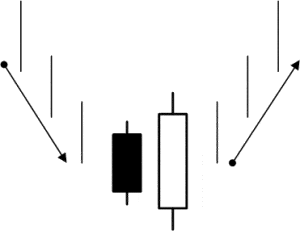
As you might have guessed, the bears are in control before the start of the Bullish Engulfing pattern. They cause a gap down, but then the bulls take the reins and cause the day to close higher than the previous day opened. This significant shift heralds a strong reversal.
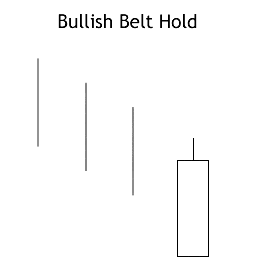
The Bullish Belthold opens near the low of the session. However, it then makes a one-eighty and shoots upward, forming a long white candlestick. The longer the candle, the greater the change in investor sentiment.
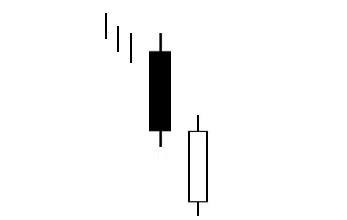
Following a strong black candle, a new candle opens low but then thrusts upward, closing at the exact same place the previous day closed (or very near to it). As the Bullish Meeting Lines isn’t the most reliable pattern around, be sure to confirm the reversal it predicts.
_____
To study each of these Japanese candlestick bullish reversal patterns in more detail, click on the links above. We have written a full blog post about each one (as well as many others) so that you can learn and review the many signals in existence. Good luck!
If you’re interested in mastering some simple but effective swing trading strategies, check out Hit & Run Candlesticks. Our methods are simple, yet powerful. We look for stocks positioned to make an unusually large percentage move, using high percentage profit patterns as well as powerful Japanese Candlesticks. Our services include coaching with experienced swing traders, training clinics, and daily trading ideas. To sign up for a membership, please click here.


Comments are closed.