Uneventful Monday: Tuesday?

Use Only this special Promo code SAV50

At hit and Run Candlesticks, we focus on Stocks / Simple Directional Options

The market (SPY), For the most part, a very uneventful day yesterday, the market didn’t seem to care about 5% of the world oil being blown up. Perhaps the market will be more interested in the possible .25 point cut. The close yesterday like previous 12 days were all above the T-Line, we call that a T-Line Run. A close below the T-Line, the sellers, could take us to about $297.00, a bit more and the 50-SMA become vulnerable. Currently, the Bulls still outnumber the Bears; you can see this because of the trend and price action is still above the trends and moving averages. The T2122 chart is running high in the overbought area and has failed to make a higher high compared to the last three runs. (Looking at a 3-day chart)

SMS text alerts and reminders?👈

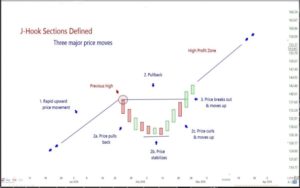
J-Hook Continuation Pattern While there are several continuation patterns in trading, the J-Hook Continuation Pattern is one that is a very decisive and can be easily identified since it forms the letter J.  If the chart pattern is followed, entered at the right time and unfolds as expected, it can be very profitable.  J-Hooks may also be called by other names like Thunderbolts and 123 formations.

There are three necessary parts to the pattern 1) a strong upward move in price 2) a pullback and 3) an up move which should continue into a breakout above the previous pivot high in price to complete the pattern and continue the uptrend.  Figure 1 presents the three price movements that take place as a J-Hook develops. 

TheThe I path Series S&P 500 VXX Short Term Futures ETN. The VXX closed below the T-Line (bearish), closed with a Doji on the 2-day chart. The VXX is also near support. Always trade with caution.

Trade-Ideas

For Your Consideration: Here are a few tickers we will be adding to our swing trade watch-list. XON, FTCH, CIEN, WWE, ALKS, LMT, CLDR, GWRE, BKI, MASI, V, TRI, BURLTrade smart, and trade your trade. Stocks we mention and talk about are not recommendations to buy or sell.

😊 Have a great trading day – Rick

Check out our newest YouTube videos👈

$50.00 discount with code: Privilege

🎯 Mike Probst: Rick, Got CTL off the scanner today. Already up 30%. Love it.

🎯 Dick Carp: the scanner paid for the year with HES-thank you

🎯 Arnoldo Bolanos: LTA scanner really works $$, thanks Ed.

🎯 Bob S: LTA is incredible…. I use it … would not trade without it

🎯 Malcolm .: Posted in room 2, @Rick… I used the LTA Scanner to go through hundreds of stocks this weekend and picked out three to trade:  PYPL, TGT, and ZS.   Quality patterns and with my trading, up 24%, 7% and 12%…. this program is gold.

🎯 Friday 6/21/19  (10:09 am) Aaron B: Today, my account is at +190% since January. Thanks, RWO HRC Flash Malcolm Thomas Steve Ed Bob S Bob C Mike P and everyone that contributes every day. I love our job.

Disclosure: We do not act on all trades we mention, and not all mentions acted on the day of the mention. All trades we mention are for your consideration only.

Free YouTube Education  •  Subscription PlansPrivate 2-Hour Coaching

DISCLAIMER: Investing / Trading involves significant financial risk and is not suitable for everyone. No communication from Hit and Run Candlesticks Inc, its affiliates or representatives is not financial or trading advice. All information provided by Hit and Run Candlesticks Inc, its affiliates and representatives are intended for educational purposes only. You are advised to test any new trading approach before implementing it.  Past performance does not guarantee future results.  Terms of Service

Oil Event Causes Ripple

Use Only this special Promo code SAV50

At hit and Run Candlesticks, we focus on Stocks / Simple Directional Options

The market (SPY), Yesterday was a tremendous money-making day in the market, all thanks to the LTA Scanner and a few critical indicators on our charts. The SPY is on a beautiful T-Line Run, and it will last until it doesn’t, watch price action. Price action over the past ten days has gone from below the T-Bands to above the T-Bands, a bullish move for the buyers. Let’s keep our eyes on the $302.23 high and the price staying above the T-Line. Any changes we will post an update.

SMS text alerts and reminders?👈

Bullish Cup and Handle Pattern: The “cup and handle formation” is a bullish signal pointing to a continuation of the current trend. It may extend over several weeks or even months and contains specific attributes.
As with any continuation pattern, you rely on confirmation in one form or another. This may occur as a second technical price signal, a candlestick continuation, volume spike, or change in momentum.
There are several parts to the cup and handle. First is the cup, which is a rounded bottom extending over time. As the shape of the cup is completed, expect the handle to emerge. This is a swing trade in the opposite direction, characterized by a specific channel between resistance and support, forming as a pennant or similar channel movement and, quite often, separated from the “cup” with an upside gap. As the handle declines and concludes, price reverses, moving again to the upside and setting up as a breakout from previous resistance. Read More

The I path Series S&P 500 VXX Short Term Futures ETN. The VXX is looking at a bounce today with the oil situation. The VXX is already in a 13-Min premarket (RBB) Pattern. Above @23.60 the VXX could get to the 34-EMA and the 5-SMA on the daily chart.

Trade-Ideas

For Your Consideration: Here are a few tickers we will be adding to our swing trade watch-list. PGC, NVAX, XEC, AXSM, WB, MCD, SBUX, SHOP Trade smart, and trade your trade. Stocks we mention and talk about are not recommendations to buy or sell

😊 Have a great trading day – Rick

Check out our newest YouTube videos👈

$50.00 discount with code: Privilege

🎯 Mike Probst: Rick, Got CTL off the scanner today. Already up 30%. Love it.

🎯 Dick Carp: the scanner paid for the year with HES-thank you

🎯 Arnoldo Bolanos: LTA scanner really works $$, thanks Ed.

🎯 Bob S: LTA is incredible…. I use it … would not trade without it

🎯 Malcolm .: Posted in room 2, @Rick… I used the LTA Scanner to go through hundreds of stocks this weekend and picked out three to trade:  PYPL, TGT, and ZS.   Quality patterns and with my trading, up 24%, 7% and 12%…. this program is gold.

🎯 Friday 6/21/19  (10:09 am) Aaron B: Today, my account is at +190% since January. Thanks, RWO HRC Flash Malcolm Thomas Steve Ed Bob S Bob C Mike P and everyone that contributes every day. I love our job.

Disclosure: We do not act on all trades we mention, and not all mentions acted on the day of the mention. All trades we mention are for your consideration only.

Free YouTube Education  •  Subscription PlansPrivate 2-Hour Coaching

DISCLAIMER: Investing / Trading involves significant financial risk and is not suitable for everyone. No communication from Hit and Run Candlesticks Inc, its affiliates or representatives is not financial or trading advice. All information provided by Hit and Run Candlesticks Inc, its affiliates and representatives are intended for educational purposes only. You are advised to test any new trading approach before implementing it.  Past performance does not guarantee future results.  Terms of Service

Bullish T-Line Run

SMS text alerts and reminders?👈

At hit and Run Candlesticks, we focus on Stocks / Simple Directional Options

Use Only this special Promo code SAV50

The market (SPY), Yesterday was a tremendous money-making day in the market, all thanks to the LTA Scanner and a few critical indicators on our charts. The SPY is on a beautiful T-Line Run, and it will last until it doesn’t, watch price action. Price action over the past ten days has gone from below the T-Bands to above the T-Bands, a bullish move for the buyers. Let’s keep our eyes on the $302.23 high and the price staying above the T-Line. Any changes we will post an update.

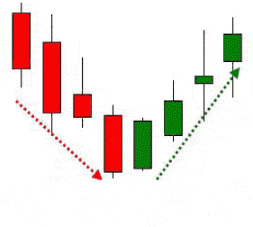
Bullish Hook Reversal Pattern As a trader, it might feel like you spend all your time watching the waters and waiting for a signal to “tug at your fishing line.” Although you may have to throw a few fish back to sea along the way, once you spot the Bullish Hook Reversal pattern, you’ll know that you have a winner. A highly reliable signal, this short-to-medium candlestick pattern heralds a reversal in investor sentiment. However, if you want to catch this elusive pattern, you will need to learn (1) what it looks like and (2) what it’s trying to say. For help, use the succinct summary we’ve created below. Read More

The I path Series S&P 500 VXX Short Term Futures ETN. All though VXX is getting near support I don’t see buyers stepping in as of the close yesterday. Watch the price action and the T-Line.

Trade-Ideas

For Your Consideration: Here are a few tickers we will be adding to our swing trade watch-list. FTCH, ALKS, NEWR, RDUS, MDCO, VSAT, LW, WWD, MLM Trade smart, and trade your trade. Stocks we mention and talk about are not recommendations to buy or sell.

😊 Have a great trading day – Rick

Check out our newest YouTube videos👈

$50.00 discount with code: Privilege

🎯 Mike Probst: Rick, Got CTL off the scanner today. Already up 30%. Love it.

🎯 Dick Carp: the scanner paid for the year with HES-thank you

🎯 Arnoldo Bolanos: LTA scanner really works $$, thanks Ed.

🎯 Bob S: LTA is incredible…. I use it … would not trade without it

🎯 Malcolm .: Posted in room 2, @Rick… I used the LTA Scanner to go through hundreds of stocks this weekend and picked out three to trade:  PYPL, TGT, and ZS.   Quality patterns and with my trading, up 24%, 7% and 12%…. this program is gold.

🎯 Friday 6/21/19  (10:09 am) Aaron B: Today, my account is at +190% since January. Thanks, RWO HRC Flash Malcolm Thomas Steve Ed Bob S Bob C Mike P and everyone that contributes every day. I love our job.

Disclosure: We do not act on all trades we mention, and not all mentions acted on the day of the mention. All trades we mention are for your consideration only.

Free YouTube Education  •  Subscription PlansPrivate 2-Hour Coaching

DISCLAIMER: Investing / Trading involves significant financial risk and is not suitable for everyone. No communication from Hit and Run Candlesticks Inc, its affiliates or representatives is not financial or trading advice. All information provided by Hit and Run Candlesticks Inc, its affiliates and representatives are intended for educational purposes only. You are advised to test any new trading approach before implementing it.  Past performance does not guarantee future results.  Terms of Service

Mid-Day 9/11/2019

SMS text alerts and reminders?👈

🎯ABBV has tuned as a great trade currently up 62%. ABBV is an (RBB) setup. Working the plan is key.

Yesterday we bought URBN up 25% another (RBB) set up. Working the plan to profits. We also bought UTHR up 2 % today so far, and we bought ZG up 1% today. Both UTHR and ZG came from one of our new Candlesticks scans. Stay in touch with us.

At Hit and Run Candlesticks, we focus on Stocks / Simple Directional Options

Connect with us on Facebook, alerts and free trade ideas from time to time. Connect

Don’t forget to leave us a note.

Connect with us through your smartphone with text alerts, reminders and free trade ideas from time to time. Connect

$50.00 discount with code: Privilege

Disclosure: We do not act on all trades we mention, and not all mentions acted on the day of the mention. All trades we mention are for your consideration only.

Free YouTube Education  •  Subscription PlansPrivate 2-Hour Coaching

DISCLAIMER: Investing / Trading involves significant financial risk and is not suitable for everyone. No communication from Hit and Run Candlesticks Inc, its affiliates or representatives is not financial or trading advice. All information provided by Hit and Run Candlesticks Inc, its affiliates and representatives are intended for educational purposes only. You are advised to test any new trading approach before implementing it.  Past performance does not guarantee future results.  Terms of Service

Bulls Still Holding

SMS text alerts and reminders?👈

At hit and Run Candlesticks, we focus on Stocks / Simple Directional Options

Use Only this special Promo code SAV50

The market (SPY), Yesterday the SPY came close to testing the $294.00 support line and may still do it. While the price is above the $295.00 support line we will remain bullish. Price may bounce around and drive traders crazy. A breakout of $200.20 will surely test the July highs, and a breakdown below the support line will be looking at the recent lows.

Secret Sauce

Secret Sauce> There are many aspects a successful seasoned swing trader considers while planning a trade. The Top 7 we focus on are the ones above in the image. Take action to gain the most knowledge during your membership with us: Focus on price, price support, price resistance price trending and more

. Read More

The I path Series S&P 500 VXX Short Term Futures ETN. The VXX chart has been below the T-Bands for 4-day now, no fear yet. The weekly chart is showing a reversal chart pattern setting up off the bottom, be cautious.

Trade-Ideas

For Your Consideration: Here are a few tickers we will be adding to our swing trade watch-list. GMED, BERY, BA, PFE, SHW, ABBV, KO, URTH, Trade smart and trade your trade. All stocks ticker we mention and talk about are not recommendations to buy or sell.

😊 Have a great trading day – Rick

Check out our newest YouTube videos👈

$50.00 discount with code: Privilege

🎯 Mike Probst: Rick, Got CTL off the scanner today. Already up 30%. Love it.

🎯 Dick Carp: the scanner paid for the year with HES-thank you

🎯 Arnoldo Bolanos: LTA scanner really works $$, thanks Ed.

🎯 Bob S: LTA is incredible…. I use it … would not trade without it

🎯 Malcolm .: Posted in room 2, @Rick… I used the LTA Scanner to go through hundreds of stocks this weekend and picked out three to trade:  PYPL, TGT, and ZS.   Quality patterns and with my trading, up 24%, 7% and 12%…. this program is gold.

🎯 Friday 6/21/19  (10:09 am) Aaron B: Today, my account is at +190% since January. Thanks, RWO HRC Flash Malcolm Thomas Steve Ed Bob S Bob C Mike P and everyone that contributes every day. I love our job.

Disclosure: We do not act on all trades we mention, and not all mentions acted on the day of the mention. All trades we mention are for your consideration only.

Free YouTube Education  •  Subscription PlansPrivate 2-Hour Coaching

DISCLAIMER: Investing / Trading involves significant financial risk and is not suitable for everyone. No communication from Hit and Run Candlesticks Inc, its affiliates or representatives is not financial or trading advice. All information provided by Hit and Run Candlesticks Inc, its affiliates and representatives are intended for educational purposes only. You are advised to test any new trading approach before implementing it.  Past performance does not guarantee future results.  Terms of Service
T-Line Back Above 34-EMA

SMS text alerts and reminders?👈

At hit and Run Candlesticks, we focus on Stocks / Simple Directional Options

The buyers have done a great job this past week, and as of Fridays close and today (Monday) Futures, the buyers plan on the same type of price action, slow steady and inching it’s self up. Over the last few days, price action has been bullish enough to bring the T-Line back above the 34-EMA, we now have a bullish trend based on the T-Line and The 34-EMA above $294.15 and resistance in the $298.80 to the $302.00 area. While a pullback to test the recent breakout ($294.15) would be common, a breakout down below $295.15 would suggest the bears are still around. T2122 is still overbought, and the VXX showed no fear Friday.

Japanese Candlesticks: Japanese Candlesticks are leading indicator among individual traders, mainly because they are easier to learn and interpret versus bar charts. Of equal importance is the fact that they fall into the category of leading indicators. Unlike lagging indicators (for example; a moving average) which appear after the event, the Japanese Candlesticks signals are leading indicators because they provide early warning alerts to possible price movements. When you see one of these alerts confirmed by moving averages, they can provide profitable trade opportunities. Read More

The I path Series S&P 500 VXX Short Term Futures ETN. Price action and fear has been weak the last few days as the price is still dropping to and looking for support and buyers. For a VXX trade, we will be waiting for the prober candle pattern and price action for a clue to trade.

Trade-Ideas

For Your Consideration: Here are a few tickers we will be adding to our swing trade watch-list. SNAP, MTN, DVA, HP, ANGI, IART, VMC, HIS, BB, Trade smart and trade your trade. These and all stocks ticker we mention and talk about are not recommendations to buy or sell.

😊 Have a great trading day – Rick

Check out our newest YouTube videos👈

$50.00 discount with code: Privilege

🎯 Mike Probst: Rick, Got CTL off the scanner today. Already up 30%. Love it.

🎯 Dick Carp: the scanner paid for the year with HES-thank you

🎯 Arnoldo Bolanos: LTA scanner really works $$, thanks Ed.

🎯 Bob S: LTA is incredible…. I use it … would not trade without it

🎯 Malcolm .: Posted in room 2, @Rick… I used the LTA Scanner to go through hundreds of stocks this weekend and picked out three to trade:  PYPL, TGT, and ZS.   Quality patterns and with my trading, up 24%, 7% and 12%…. this program is gold.

🎯 Friday 6/21/19  (10:09 am) Aaron B: Today, my account is at +190% since January. Thanks, RWO HRC Flash Malcolm Thomas Steve Ed Bob S Bob C Mike P and everyone that contributes every day. I love our job.

Disclosure: We do not act on all trades we mention, and not all mentions acted on the day of the mention. All trades we mention are for your consideration only.

Free YouTube Education  •  Subscription PlansPrivate 2-Hour Coaching

DISCLAIMER: Investing / Trading involves significant financial risk and is not suitable for everyone. No communication from Hit and Run Candlesticks Inc, its affiliates or representatives is not financial or trading advice. All information provided by Hit and Run Candlesticks Inc, its affiliates and representatives are intended for educational purposes only. You are advised to test any new trading approach before implementing it.  Past performance does not guarantee future results.  Terms of Service

Price Holding Ground

SMS text alerts and reminders?👈

At hit and Run Candlesticks, we focus on Stocks / Simple Directional Options

The market (SPY), The SPY broke out yesterday and held its ground yesterday, closing above $294.25. Resistance has now become support. A challenge of all-time highs is now back on the table with follow-through from the market. Back below $294.25 would be a different story. Yesterday in the trading room we saw tons of profit scooped up by members, myself included because of the gap up and the possibility of a Friday rest day, yesterday was a great day! KO up 22%, WDC up 51%, MU up 30%, up 27% WMT. We will be watching for new setups that have pulled back to or near support that has met our conditions for trade. Right now the SPY is a bit high, T2122 is overbought, caution not to chase a trade, make them come to you.

Trend Reversals: A trend reversal does not mean that the prices will reverse (as you might be inclined to think). Instead, it indicates that the prior trend should change. The prices may reverse as well, but the trend’s direction is the important thing here. A trend reversal pattern is considered successful if the trend changes after the pattern appeared, whether the trend changes from upward to downward, downward to sideways, sideways to upward, etc. Read more about Candlesticks and Trend Reversals

The I path Series S&P 500 VXX Short Term Futures ETN.  Price action has dropped below all out T-Band trend lines suggesting the last few days lacked fear. The VXX is now approaching a little support, with the right price action, we could see a T-Band challenge.

Trade-Ideas

Ya baby it’s Friday! For Hit and Run Candlesticks, Friday’s are more about profit-taking and getting ready for the weekend. There are no watch-list updates on Fridays. We wish you a fantastic weekend.

😊 Have a great trading day – Rick

Check out our newest YouTube videos👈

$50.00 discount with code: Privilege

🎯 Mike Probst: Rick, Got CTL off the scanner today. Already up 30%. Love it.

🎯 Dick Carp: the scanner paid for the year with HES-thank you

🎯 Arnoldo Bolanos: LTA scanner really works $$, thanks Ed.

🎯 Bob S: LTA is incredible…. I use it … would not trade without it

🎯 Malcolm .: Posted in room 2, @Rick… I used the LTA Scanner to go through hundreds of stocks this weekend and picked out three to trade:  PYPL, TGT, and ZS.   Quality patterns and with my trading, up 24%, 7% and 12%…. this program is gold.

🎯 Friday 6/21/19  (10:09 am) Aaron B: Today, my account is at +190% since January. Thanks, RWO HRC Flash Malcolm Thomas Steve Ed Bob S Bob C Mike P and everyone that contributes every day. I love our job.

Disclosure: We do not act on all trades we mention, and not all mentions acted on the day of the mention. All trades we mention are for your consideration only.

Free YouTube Education  •  Subscription PlansPrivate 2-Hour Coaching

DISCLAIMER: Investing / Trading involves significant financial risk and is not suitable for everyone. No communication from Hit and Run Candlesticks Inc, its affiliates or representatives is not financial or trading advice. All information provided by Hit and Run Candlesticks Inc, its affiliates and representatives are intended for educational purposes only. You are advised to test any new trading approach before implementing it.  Past performance does not guarantee future results.  Terms of Service

Resistance Breakout Today

SMS text alerts and reminders?👈

At hit and Run Candlesticks, we focus on Stocks / Simple Directional Options

The market (SPY), With futures up this morning on Trade Talk meetings and some Hong Kong headway we will see a breakout of the early August resistant level. And I am sure you know how crucial bullish control and follow-through is. Bullish follow-through above about $294.25 could run back price action into the $300.00 area for a July high challenge. Please note this is all based on the bulls taking the ball back. We are only one tweet away from 300-500 point moves in this crazy market. If you follow the T-Line Bands the SPY weekly chart, you can see the last 5 bars testing the lower red line, challenging the mid-blue line.

Trading The T-Line Trading the T-Line, also known as the trigger line or trend line, works well for all trading plans and investment strategies. If you want to embrace this strategy, look into (what I call) the T-Line run. T-Line runs can be very profitable if you know how to identify them and use them properly. Curious? Read on to learn more about the types of T-Line run, get some helpful application tips, and learn how to confirm your trades to make smart entrances and exits. Trading The T-Line

The I path Series S&P 500 VXX Short Term Futures ETN.  The VXX weakness yesterday closed below the 34-EMA, and today the bearish price action in the VIX should pull the T-Line down with it. The price action the vix is demonstrating the lack of fear trader now have.

Trade-Ideas

For your consideration: Here are a few charts I thought should go on the watch-List, remember to trade your trade. SFM, CVS, COST, SHAK, TLRY, PG, CMG, ZAYO, UPS, KR. Trade smart and wait for the QEP→ (QEP) Quality Entry Patterns). We do not recommend stocks to trade

😊 Have a great trading day – Rick

Check out our newest YouTube videos👈

$50.00 discount with code: Privilege

🎯 Mike Probst: Rick, Got CTL off the scanner today. Already up 30%. Love it.

🎯 Dick Carp: the scanner paid for the year with HES-thank you

🎯 Arnoldo Bolanos: LTA scanner really works $$, thanks Ed.

🎯 Bob S: LTA is incredible…. I use it … would not trade without it

🎯 Malcolm .: Posted in room 2, @Rick… I used the LTA Scanner to go through hundreds of stocks this weekend and picked out three to trade:  PYPL, TGT, and ZS.   Quality patterns and with my trading, up 24%, 7% and 12%…. this program is gold.

🎯 Friday 6/21/19  (10:09 am) Aaron B: Today, my account is at +190% since January. Thanks, RWO HRC Flash Malcolm Thomas Steve Ed Bob S Bob C Mike P and everyone that contributes every day. I love our job.

Disclosure: We do not act on all trades we mention, and not all mentions acted on the day of the mention. All trades we mention are for your consideration only.

Free YouTube Education  •  Subscription PlansPrivate 2-Hour Coaching

DISCLAIMER: Investing / Trading involves significant financial risk and is not suitable for everyone. No communication from Hit and Run Candlesticks Inc, its affiliates or representatives is not financial or trading advice. All information provided by Hit and Run Candlesticks Inc, its affiliates and representatives are intended for educational purposes only. You are advised to test any new trading approach before implementing it.  Past performance does not guarantee future results.  Terms of Service

Wacky Wednesday

SMS text alerts and reminders?👈

At hit and Run Candlesticks, we focus on Stocks / Simple Directional Options

Still no real direction even with the futures being up this morning. Honk Kong is taking some of the concern off the table for the market but is it enough for the charts. Looks like we are receiving a price gap up this morning above the 34-EMA and below the 50-SMA, the end of day price action could be very important to the charts. A close above $294.00 would show positive bullish intent. While a close below yesterday’s Doji $290.45 would show bearish intent. I still suspect more chop and indecision awaits us, swing traders.

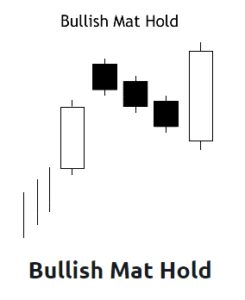
Bullish Mat Hold Pattern: Any wrestling fans out there? When you think of the Bullish Mat Hold pattern, think of the bears as a determined but fatigued wrestler, trying to hold the bulls to the mat. After gaining control of the bulls, they make a few short pushes to lower the price, but they are ultimately defeated. They simply can’t match the bulls’ tenacity! Although the Bullish Mat Hold is known to be trustworthy and true, it occurs infrequently. For help spotting this bullish continuation pattern when it does make a chance appearance, review the information below and keep your eyes peeled! .Read More Bullish Mat Hold Pattern.

The I path Series S&P 500 VXX Short Term Futures ETN.  A close today above the 34-EMA keeps the VXX in a bullish chart pattern, a close above $28.85 would spark fear.  

Trade-Ideas

For your consideration: Here are a few charts I thought should go on the watch-List, remember to trade your trade. MLM, WB, SUM, DVAX, WDC, CVS, Trade smart and wait for the QEP→ (QEP) Quality Entry Patterns). These Trade ideas are not recommendations.

😊 Have a great trading day – Rick

Check out our newest YouTube videos👈

$50.00 discount with code: Privilege

🎯 Mike Probst: Rick, Got CTL off the scanner today. Already up 30%. Love it.

🎯 Dick Carp: the scanner paid for the year with HES-thank you

🎯 Arnoldo Bolanos: LTA scanner really works $$, thanks Ed.

🎯 Bob S: LTA is incredible…. I use it … would not trade without it

🎯 Malcolm .: Posted in room 2, @Rick… I used the LTA Scanner to go through hundreds of stocks this weekend and picked out three to trade:  PYPL, TGT, and ZS.   Quality patterns and with my trading, up 24%, 7% and 12%…. this program is gold.

🎯 Friday 6/21/19  (10:09 am) Aaron B: Today, my account is at +190% since January. Thanks, RWO HRC Flash Malcolm Thomas Steve Ed Bob S Bob C Mike P and everyone that contributes every day. I love our job.

Disclosure: We do not act on all trades we mention, and not all mentions acted on the day of the mention. All trades we mention are for your consideration only.

Free YouTube Education  •  Subscription PlansPrivate 2-Hour Coaching

DISCLAIMER: Investing / Trading involves significant financial risk and is not suitable for everyone. No communication from Hit and Run Candlesticks Inc, its affiliates or representatives is not financial or trading advice. All information provided by Hit and Run Candlesticks Inc, its affiliates and representatives are intended for educational purposes only. You are advised to test any new trading approach before implementing it.  Past performance does not guarantee future results.  Terms of Service

More Chop, No Direction

SMS text alerts and reminders?👈

At hit and Run Candlesticks, we focus on Stocks / Simple Directional Options

The market (SPY), More chop and no direction, Friday the buyers had a chance to break out and stay out of the sideways channel they have been playing in, but instead, they started the day with a bullish bang and ended with a fizzle. Here is Tuesday morning after a 3-day weekend and the futures are pointing to a weak open possible below the 34-EMA. The question for the day is where we will close for the day? A close above $ 292.15 we would consider cautiously bullish and below $290.60 bearish

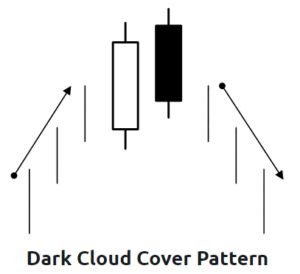
Bearish Dark Cloud Cover Pattern: Do you have an umbrella handy? When dark clouds are on the horizon, you know that a downpour could soon be on the way.

Similarly, when you spot the Dark Cloud Cover pattern on a Japanese candlestick chart, you need to anticipate the arrival of a bearish reversal. This candlestick pattern is somewhat easy to spot because its formation clearly reflects its name: at the end of an uptrend (i.e., a sunny day), a black candle appears (a “dark cloud”), heralding a reversal. Let’s learn a little more about this ominous signal… .Read More Dark Cloud Cover Pattern.

The I path Series S&P 500 VXX Short Term Futures ETN.  A close today above the 34-EMA keeps the VXX in a bullish chart pattern, a close above $28.85 would spark fear.  

😊 Have a great trading day – Rick

Trade-Ideas

September 3, 2019, No Trade Ideas Today. Trade smart and wait for the QEP→ (QEP) Quality Entry Patterns). These Trade ideas are not recomendations.

Check out our newest YouTube videos👈

$50.00 discount with code: Privilege

🎯 Mike Probst: Rick, Got CTL off the scanner today. Already up 30%. Love it.

🎯 Dick Carp: the scanner paid for the year with HES-thank you

🎯 Arnoldo Bolanos: LTA scanner really works $$, thanks Ed.

🎯 Bob S: LTA is incredible…. I use it … would not trade without it

🎯 Malcolm .: Posted in room 2, @Rick… I used the LTA Scanner to go through hundreds of stocks this weekend and picked out three to trade:  PYPL, TGT, and ZS.   Quality patterns and with my trading, up 24%, 7% and 12%…. this program is gold.

🎯 Friday 6/21/19  (10:09 am) Aaron B: Today, my account is at +190% since January. Thanks, RWO HRC Flash Malcolm Thomas Steve Ed Bob S Bob C Mike P and everyone that contributes every day. I love our job.

Disclosure: We do not act on all trades we mention, and not all mentions acted on the day of the mention. All trades we mention are for your consideration only.

Free YouTube Education  •  Subscription PlansPrivate 2-Hour Coaching

DISCLAIMER: Investing / Trading involves significant financial risk and is not suitable for everyone. No communication from Hit and Run Candlesticks Inc, its affiliates or representatives is not financial or trading advice. All information provided by Hit and Run Candlesticks Inc, its affiliates and representatives are intended for educational purposes only. You are advised to test any new trading approach before implementing it.  Past performance does not guarantee future results.  Terms of Service