
Just last week we discussed the Three Stars in the South candlestick pattern, a rare bullish reversal signal composed of three candles, each slightly smaller than the one preceding it. Funnily enough, another pattern contains “three stars” and forecasts a takeover by the bulls. The Bullish Tri-Star candlestick pattern, as you might have guessed, also contains three candles. It shares the rarity of the Three Stars in the South pattern, but its candles actually look somewhat like stars because they are doji (and thus, don’t typically have real bodies). To learn more about this elusive signal, please scroll down.
Bullish Tri-Star Candlestick Pattern
Formation
Considering that a single doji can capture a trader’s attention, you can see why the Tri-Star is so exceptional and significant. Composed of three consecutive doji candles, it rarely appears on Japanese candlestick charts. Because of this, you might forget what the Bullish Tri-Star candlestick pattern looks like! As a reminder, you will need to spot the following criteria:
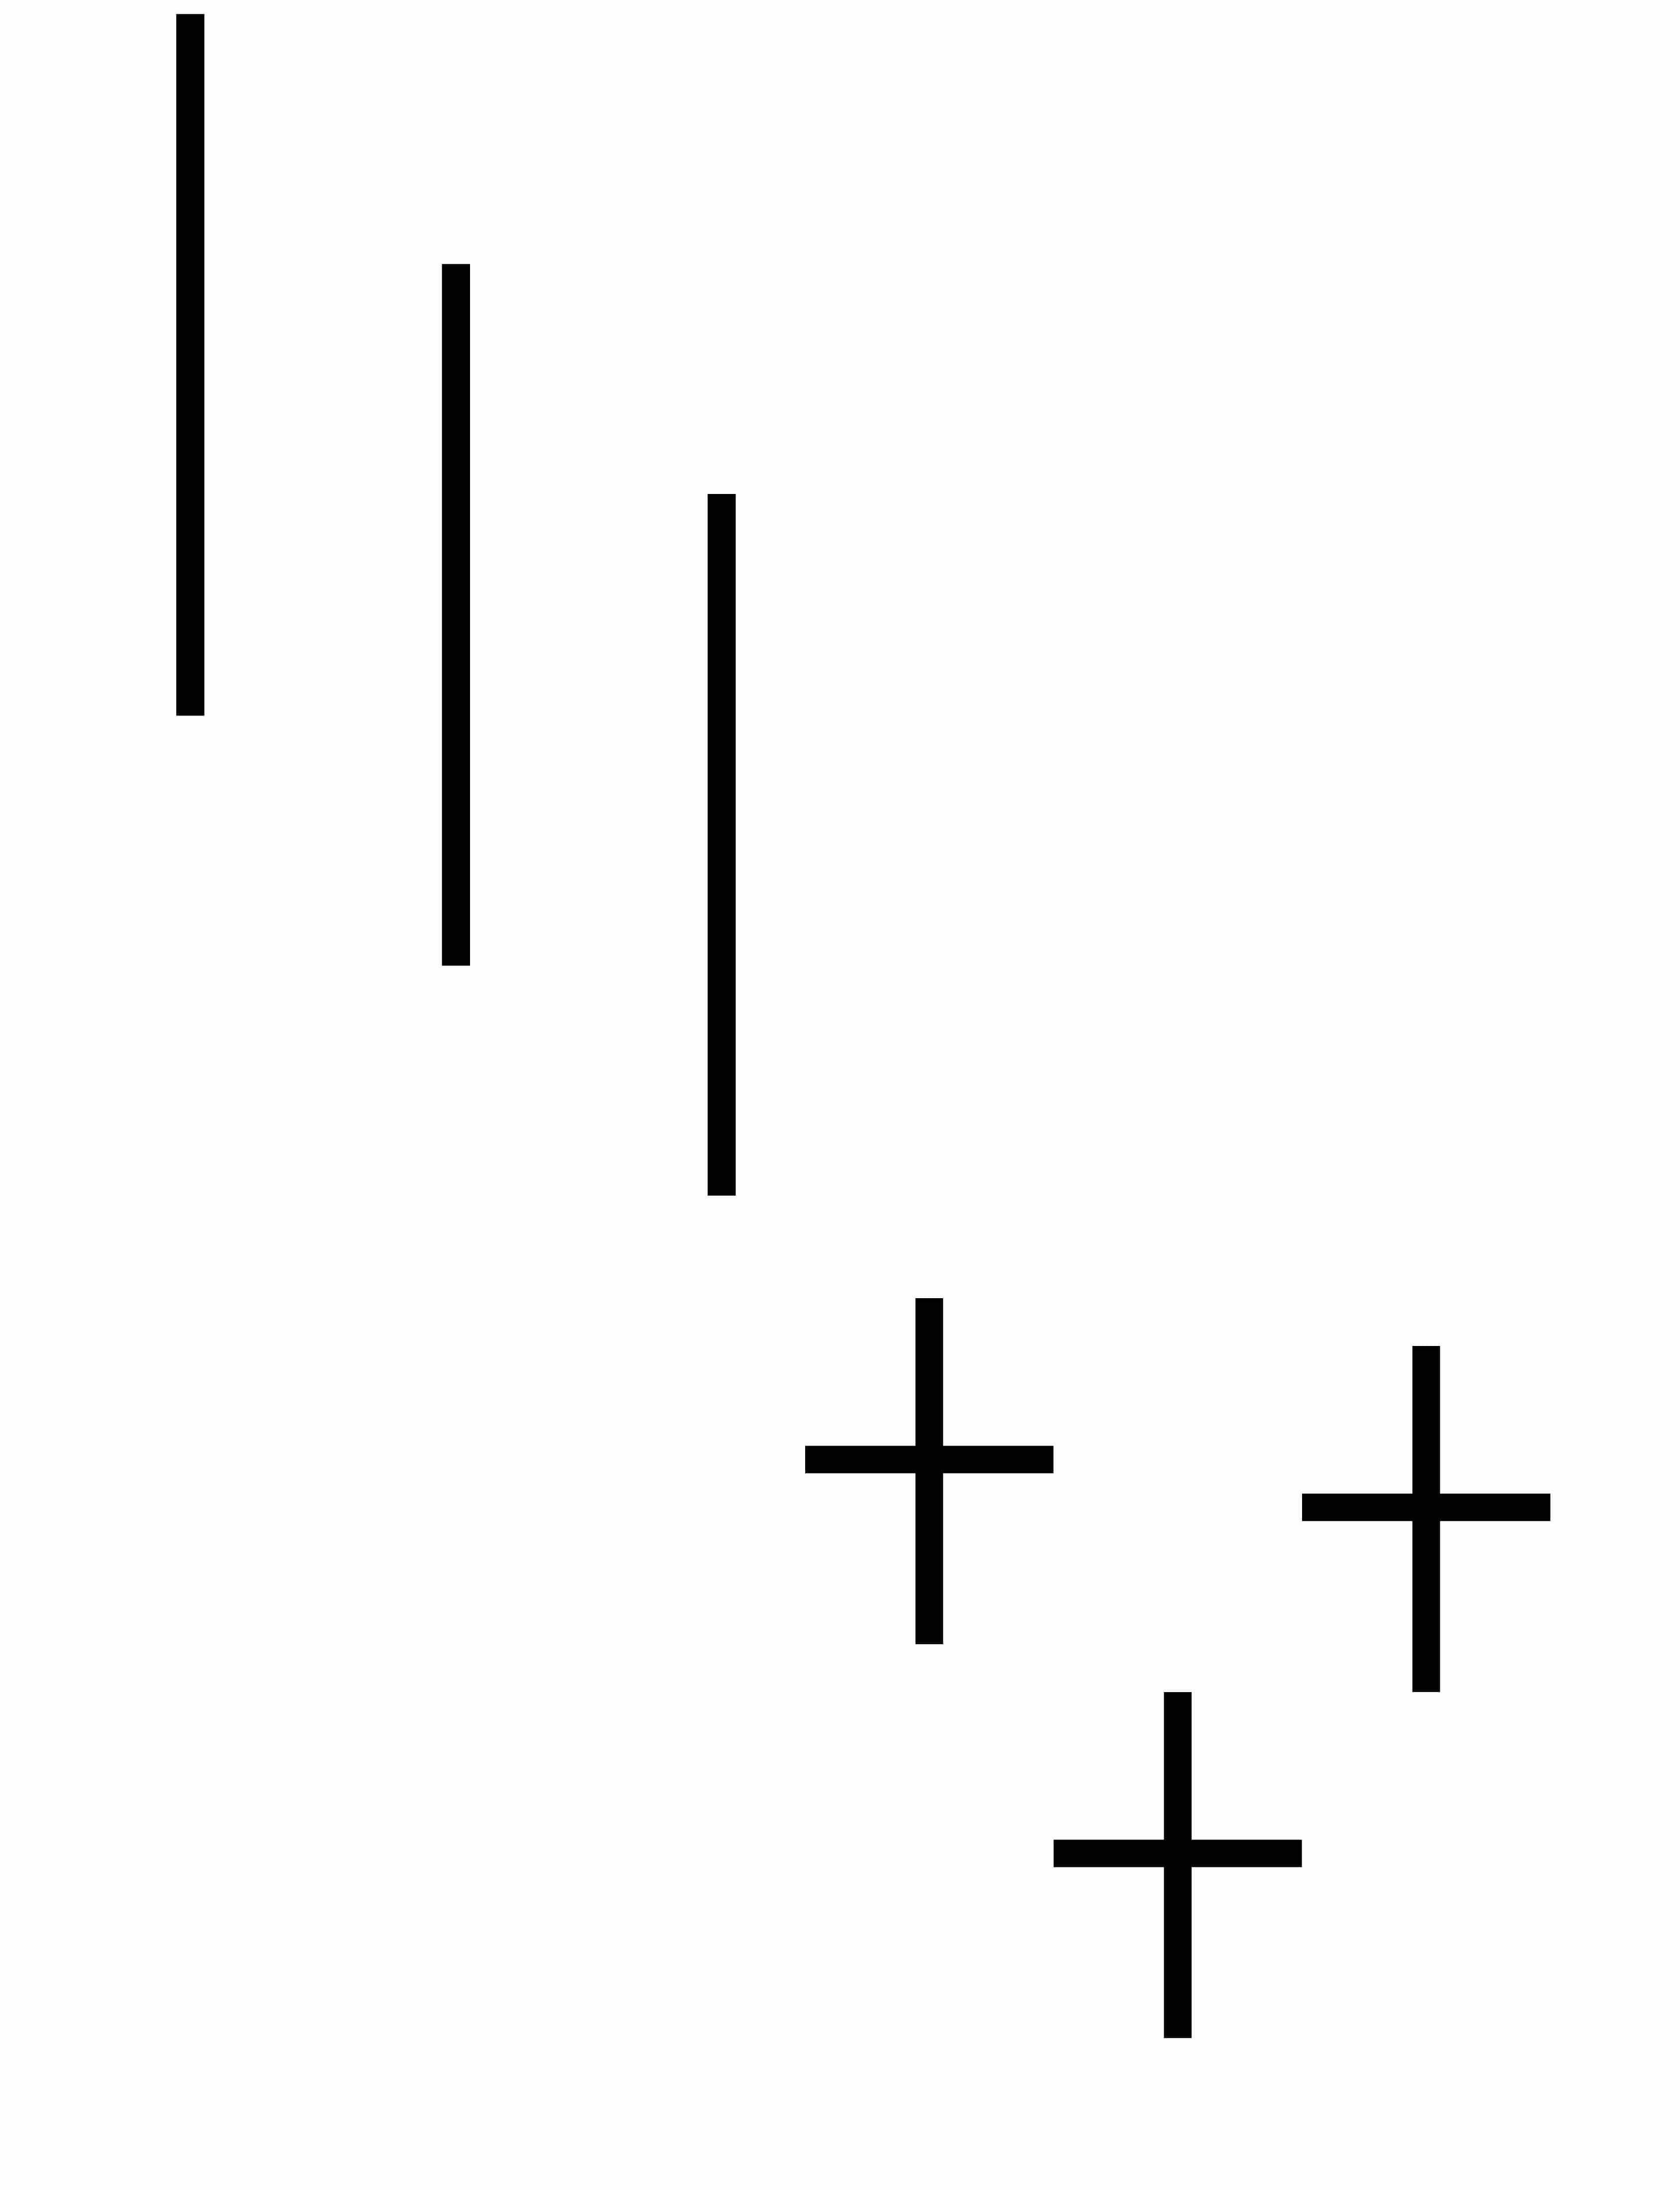
First, a clear and defined downtrend must be in progress. Second, three consecutive doji must appear. The doji is an extremely simple candlestick pattern that resembles a plus sign or a cross. Typically, it will lack a real body. If it does have a body, that body will be extremely tiny. Third, the second of the three doji must gap below the first and third, creating a V-like shape. A gap does not need to exist between the patterns’ shadows, however.
The opposite of this pattern is the Bearish Tri-Star candlestick pattern. It forms after a solid uptrend and contains three consecutive doji, with the second doji gapping up from the first and third.
Meaning
When we enter the scene, the bears hold the reins. They direct the price continually downward. However, the tide soon turns. The bulls’ strength weakens, resulting in a doji, which represents indecision. Although this first doji concerns traders, it doesn’t spark extreme shock. The second doji, however, conveys that the market has lost its downward momentum. Finally, the third doji marks extreme market indecision, forecasting a sharp reversal on the horizon.
Conclusion & Confirmation
One doji can catch a trader’s eye, so three consecutive doji certainly won’t go unnoticed. Although you won’t see the Bullish Tri-Star signal very often, you should never ignore it when it appears on your chart. In addition, before acting on its forecasted reversal, check for confirmation. You should define the last close as the confirmation level, and check that the price crosses above this level to confirm the arrival of an uptrend. You could also look for a white candlestick, a large gap up, or a higher close. Good luck!
If you’re interested in mastering some simple but effective swing trading strategies, check out Hit & Run Candlesticks. Our methods are simple, yet powerful. We look for stocks positioned to make an unusually large percentage move, using high percentage profit patterns as well as powerful Japanese Candlesticks. Our services include coaching with experienced swing traders, training clinics, and daily trading ideas. To sign up for a membership, please click here.


Comments are closed.