Rick’s Featured Trade Ideas
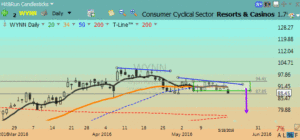
WYNN/Short |H&S| BIF | T-Line™ Chart trending down
 WYNN| Plan your trade & trade your plan | May 19, 2016
Possible entry plan idea: Short box $91.40- $87.85
Possible stop plan idea: Short stop below $91.40
Swing trade playground: $91.80- $76.20 =16%
Playground risk reward: 7:1 + depending on | entry | exit | stop
SPY: T-Line ™ chart suggest the sellers are in control.
7:00 am: FEDS Hawkish, market down, dollar up, XLF up, OIH down
It doesn’t appear that the market likes the Fed decision of raising rates in June, or for that matter, any time. As of April 20, the SPY has produced lower highs and lower lows. Yesterday confirmed another low swing. The SPY found support near the $203.90 support line, but I am finding it a little hard to believe that $203.90 will actually support price in the current market while in the current downtrend without a major bullish reversal signal.
Based on a couple Fibonacci lines and a little support and resistance work, I see a suggestion that $201.30 may be the next supporting line followed by $199.50-ish.
XLF, the S&P financial ETF, fared quite well yesterday closing with a Bullish Engulf; we still need to see confirmation above $23.27 and a close above the downtrend line overhead.
OIH, the oil services ETF, is forming a bearish pattern that we will be talking more about in the trading room today. USO United States Oil Fund has found the 200–SMA, and we may see a little profit taking from here.
Trading knowledge ignites successful stock trading.
All the best to your trading success!
Rick
Continue Reading
Rick’s Featured Trade Ideas
No featured trade idea today, there is simply too much risk in the market when you combine the FOMC events. Being our own money managers we control, our own risk and our future.
SPY: T-Line ™ chart suggest the sellers are in control.
7:00 am: Yay, FOMC meeting minutes today! This could be a chart game changer.
The SPY remains under pressure yesterday losing .93% and confirming another failed high on high-volume. It’s been almost a month now since we started talking about a possible bearish head and shoulders in the SPY if the Bulls lost the $207.00 area. With $207.00 gone, $204.00 becomes the next possible area of support, and today’s FOMC meeting minutes will play a part in whether $204.00 is controlled by the buyers or the sellers. If the sellers end up controlling $204.00, then the $200.00 area will likely be attacked. If the buyers end up controlling the $204.00 area, we will put our eyes again back on the $207.00 area.
After last night’s members’ e-learning and looking at a few short positions for possible trading, I thought I would look at a few behind-the-scene indicators: On Balance Volume has now dropped below its average; Time Segment Volume has dropped below the centerline; MACD has rolled over.
We suggest you don’t gamble with your money. Remember, cash is a position
Trading knowledge ignites successful stock trading.
All the best to your trading success!
Rick
Continue Reading
Rick’s Featured Trade Ideas
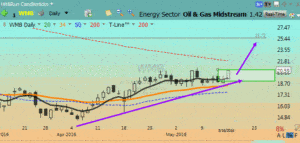
 WMB/Long |RBB| Support | 2-day Engulf | Inverse H&S | Bull “W”
WMB| Plan your trade & trade your plan | May 17, 2016
Possible entry plan idea: Buy box $19.02- $20.68
Possible stop plan idea: Protective stop below $19.02
Swing trade playground: $19.02- $29.50 = 54%
Playground risk reward: 5:1 + depending on | entry | exit | stop
SPY: T-Line ™ chart suggest the sellers are in control.
7:00 am: The SPY ended up closing over the T-Line™ yesterday up .99% tagging the 20 – SMA and helped to confirm yesterday’s higher low. The Bulls seem to be doing a great job keeping us above the $203.88 low and holding us around my very important $207.00 area.
One of my favorite charts is the 4-hour chart, so let’s take a quick look at it. Yesterday’s close remains in the shadows of lower highs; the T-Line™ and the 34-EMA are both below the 50-SMA. Even with yesterday’s bullish move, the sellers still have control.
For the traders out there that follow volume, you probably already know yesterday’s volume was relatively low on the bullish move.
Apple might’ve been the driving force yesterday keeping the market elevated as Apple gaps and closed up 3.71% above the T-Line, basically from an announcement that Buffett is taking a position.
Bottom line, we’re trading both long and short positions realizing the market is just toying with us as it moves sideways in a tightening channel.
Trading knowledge ignites successful stock trading.
All the best to your trading success!
Rick
Continue Reading
 WYNN| Plan your trade & trade your plan | May 19, 2016


