Rick’s Featured Trade Ideas
Today’s featured trade idea and my personal trade plan
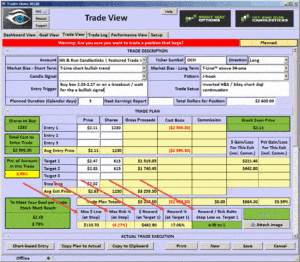
OCN/LONG |RBB| Bullish Engulf| Inverted H&S | 3day chart doji continuation
 “The Alaskan Trading Cruise” – Deposit special between June 6 and June 12, 2016
SPY: High resistance $210.93 | High support near $208.50ish
T-Line™ Chart: Trending bullish | Candle price action Doji
The SPY chart continues to suggest bullishness based on the short-term T-Line™ trend and the candlestick price action. Friday’s Doji remained above the T-Line™, and the T-Line™ is bullish when you compare it to its partner moving averages. It will be important for price to respect certain levels, such as $208.50 as support. If $208.50 falls prey to the bears, then the $207.00 area will become a line that the Bulls must defend.
Here at Hit-and-Run Candlesticks, we do not promote picking bottoms or tops, but we do promote following price action with candlesticks and waiting for a bullish or bearish signal to be made. Then we trade up based on that signal for a swing, whether its bullish or bearish. The point here is patience, and let’s make sure that the Bulls can break out.
All the best to your trading success!
Rick | Hit and Run Candlestick Team
Trading knowledge ignites successful stock trading.
Continue Reading
Rick’s Featured Trade Ideas
Today’s featured trade idea and my personal trade plan
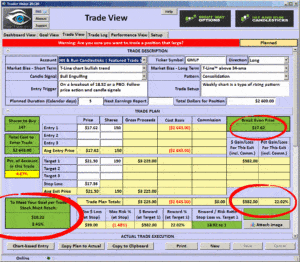
GMLP/LONG |T-Line™ chart trending | Bullish Engulf|
 Read more about “The Alaskan Trading Cruise” – Deposit special between June 6 and June 12, 2016
SPY: High resistance $211.66 | High support near $208.50ish
T-Line™ Chart: Trending bullish | Candle price action week
By the time you read this, the employment report will have already come out which may or may not impact the market. Although the market seems to have already approved of the report or it has an agenda of its own, we will soon find out. The SPY has risen 3.29% from the May 19 low to yesterday’s June 6 high on a beautifully orchestrated chart pattern, a bull kicker candlestick pattern gapping over our T-Line™ chart moving averages, a profit taking pull back that ended the day with a bullish piercing candle followed by yesterday’s strong bullish candle that closed one penny above the April 20 high. Yesterday in the trading room, it was noted by our members that this has been a very profitable 10 days.
TRADING TIP – Trade with the trend!
We will continue to follow the current bullish trend and price action realizing that minor pullbacks are opportunities.
All the best to your trading success!
Rick | Hit and Run Candlestick Team
Trading knowledge ignites successful stock trading.
Continue Reading
Rick’s Featured Trade Ideas
Today’s featured trade idea and my personal trade plan
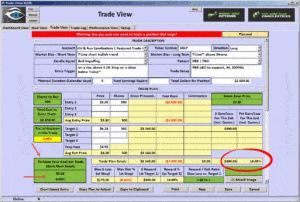
SDLP/LONG |RBB | Bullish Engulf| Support
 Read more about “The Alaskan Trading Cruise” – Deposit special between June 6 and June 12, 2016
SPY: High resistance $210.92 | High support near $208.50
T-Line™ Chart: Trending bullish | Candle price action week
After a rough open, the Bulls were able to put together a positive close that resulted in a bullish piercing candle closing .20%. It looks as if this will be another attempt to push through the April 20 high of $210.92. Our T-Line™ chart continues to rise suggesting that the Bulls are in control. Going forward, it will be important for the Bulls to close price above $210.92 for bullish confirmation. About $208.50 is what I see as support for any kind of pullback, which is just slightly below the 23.6 Fibonacci line.
All the best to your trading success!
Rick | Hit and Run Candlestick Team
Trading knowledge ignites successful stock trading.
Continue Reading
 “The Alaskan Trading Cruise” – Deposit special between June 6 and June 12, 2016


