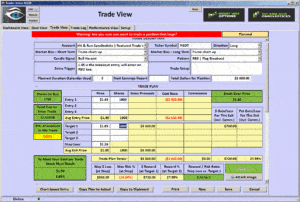
NEOT/LONG |RBB | Morning Star|
 SPY: High resistance $210.92 | High support near $207.87
T-Line™ Chart: Trending bullish | Candle price action week
It would appear that the Bulls had a little trouble getting through our $210.92 resistant line yesterday and closed for the day down .19%. Yesterday’s candle opening above Friday’s candle and closing below the 50% mark of Friday’s candle is alerting us that a little back filling may be needed. Along with the $210.92 resistant line that we have been posting, we also have been posting a support line at $207.87 which has a high probability of being tested. Using our T-Line™ chart, the swing trend remains bullish while price is demonstrating a little weakness. Without a complete confirmed sell signal or a breakdown of the supporting swing trend, we will remain bullish looking for pullback opportunities (PBO’s) while taking on a couple of trades that will work with the sellers such as the TZA trade that we took yesterday with the intention of profiting on a short-term relief rally.
For about a month now we have talked about how important $207.00 is for the Bulls and the bears. Here at Hit-And-Run Candlesticks, we will be watching this line with an eagle eye.
Trading knowledge ignites successful stock trading.
All the best to your trading success!
Rick | Hit and Run Candlestick Team
Continue Reading
Rick’s Featured Trade Ideas
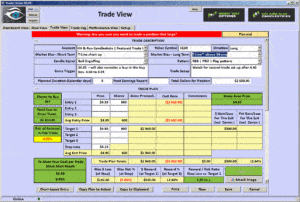
CLDX/LONG |RBB | PBO flag|
 SPY: High resistance $210.92 | High support near $207.87
7:00 am: T-Line™ Chart Bullish Friday’s close ahead of the memorial day weekend closed bullish up .43% just pennies away from the April 20 high. Technology has led the way followed by healthcare and the financials hold third-place. Basic materials brings up the rear of the 11 sector indexes I follow.
The leading sector for Friday was consumer cyclical up .80% while the loser was basic materials down .63%
The T-Line™ chart continues remains bullish with the T-Line™ leading the 14-SMA and the 14-SMA leading the 34-EMA. The SPY is getting a little overbought but no price weakness showing at Friday’s close.
Trading knowledge ignites successful stock trading.
All the best to your trading success!
Rick | Hit and Run Candlestick Team
Continue Reading
The Side by Side White Lines candlestick pattern contains twins: two candles of the same color and height standing side by side. Although visually consistent and uniform, this duo actually represents a struggle. The market opened at the same price two days in a row and closed at the same price two days in a row. Why can’t the bears successfully squash the uptrend? To better understand the shape and significance of the Bullish Side by Side White Lines pattern, keep reading.
Continue Reading
Rick’s Featured Trade Ideas
No featured trade idea today….. It’s Friday!!!!! Take some profits, reevaluate your positions.
 Remember why we have the freedom to trade the way we do. Take a minute this weekend, stop and say thank you, leave a flower or raise a glass to someone you know, a friend, anyone that has a connection to those that have fought for our freedom.
SPY: High resistance $210.92 | High support $207.87
7:00 am: T-Line™ Chart Bullish even with a minor pullback
Pretty quiet day yesterday. The SPY closed up .03% in a very narrow range painting a Doji at the end of the day. The T-Line chart has confirmed our short-term bullish trend and price continues to support this trend as well. Yesterday was the second day that the SPY could not push above the $209.76 resistance line, which will no doubt start to make swing traders a little concerned. A pullback to $207 would be a perfect swing trader’s trade, and we would accept $206.25 reluctantly. The candle pattern currently painted is what we call a “Doji continuation pattern.” This pattern is when you have a sharp rise in price and then the next day print a Doji at the high end of the previous day. Trading tip: candlestick signals require confirmation. A bullish push above $209.76 would no doubt cast the April 20 highs.
Top sector leaders yesterday were Utilities, Consumer Defensive, both Les the 1%. The two sector losers also both by 1% Energy printing a bearish dark cloud cover candle and Financial Services also printing a dark cloud cover candle.
Luxury Goods fell by 4.20% – ouch | technology computer Systems rose by 2.44%
Trading knowledge ignites successful stock trading.
All the best to your trading success!
Rick | Hit and Run Candlestick Team
Continue Reading
 SPY: High resistance $210.92 | High support near $207.87


