Rick’s Featured Trade Ideas
Today’s featured trade idea and my personal trade plan
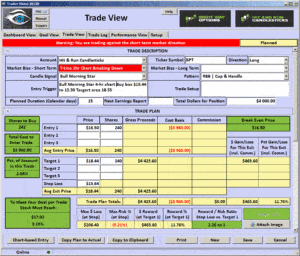
BPT/Long |RBB| Bullish Engulf | Breakout
 SPY: T-Line™ Chart: A close is needed over $203.35
Good Morning, Profit Traders,
The oversold relief rally continues according to the morning futures. Yesterday, the two numbers we posted, $202.15 and $203.35, were spot on. The morning futures fueling the relief rally puts a nice round number of $205.00 in the crosshairs for resistance followed by $206.00.
The transports remain in horrible shape with price of the weekly chart still under the 200- period moving average.
The US dollar index (DXYO) closed yesterday at $96.09, the 200-period moving average has held off the last three attempts to push through, and $95.50 is acting as support.
Overall, the market has been damaged and will take quality construction to put the market back in contention with the highs. It’s important to understand how bottoms are formed, how support needs to be tested and resistance needs to be broken down. There’s a big difference between a reversal and a relief rally. At this time, I only see a relief rally being attempted.
All the best to your trading success!
Rick | Hit and Run Candlestick Team
Trading knowledge ignites successful stock trading.
Continue Reading
June 28 | 5pm PST | 7pm CST | 8pm EST
Rick Saddler | HRC Public e-Learning
Link: http://hitandruncandlesticks.omnovia.com/room1
Password: No Password Required
Rick’s Featured Trade Ideas
Today’s featured trade idea and my personal trade plan
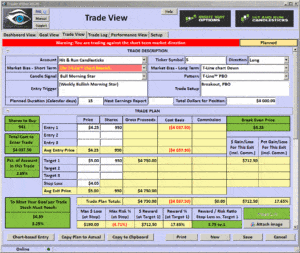
S/Long |T-Line™ PBO| Higher Highs and Higher Lows

SPY: T-Line™ Chart: A close in needed over $202.20
Good Morning, Profit Traders,
Europe is trying to bounce back but volatility remains, and today we start the relief rally phase. The SPY is set up to open higher kicking off the relief rally from a very bruised and oversold market. It’s not the open or the midday that will be the most important hour of the day; it’s the close. The question is: Will we close over $200.20, the first resistance at yesterday’s close? Today, will it act as support after the morning positive relief? $202.15 and $203.35 will be important resistance numbers that the relief rally will have to deal with.
There should be some pretty decent trades today, but I don’t believe this relief rally will continue without constructing a bottom formation.
The $199.00 area clearly acted as support yesterday as noted in our June 27 morning note.
All the best to your trading success!
Rick | Hit and Run Candlestick Team
Trading knowledge ignites successful stock trading.
Continue Reading
Rick’s Featured Trade Ideas
Today’s featured trade idea and my personal trade plan
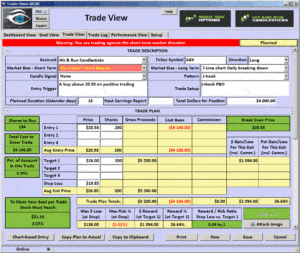
ABX/Long |J-Hook PBO| Higher Highs and Higher Lows
 SPY: T-Line™ Chart: Below 202.85 will hurt
Good Morning, Profit Traders,
The volatility should be with us for a while, but once the market has had time to absorb the recent Brexit information, it should be easier to trade. I believe there is more downside to come with relief rallies along the way. Timing the market and your charts are more important now than we have seen in a long time. It’s a good thing that we have been talking about support and resistance so much lately. The SPY looks like $199.00 could see a little support while $206.00 may offer a little resistance. At the close on Friday, Gold, Silver, Utilities and Real Estate seem to be in the best shape. Utilities are overbought.
Overall, this is a very heavy market right now with a great deal of fear because of the unknown.
All the best to your trading success!
Rick | Hit and Run Candlestick Team
Trading knowledge ignites successful stock trading.
Continue Reading
 SPY: T-Line™ Chart: A close is needed over $203.35


