Rick’s Featured Trade Ideas
Today’s featured trade idea and my personal trade plan
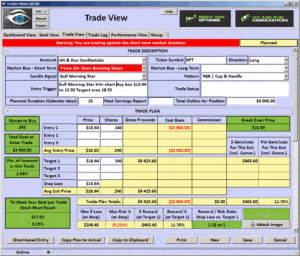
BPT/Long | RBB| C&H | 4-hr chart morning star
 SPY: T-Line™ Chart: teetering between Bullish and Bearish
Good Morning, Profit Traders,
With a very flat narrow range in the overall market yesterday, it’s extremely clear that everyone is waiting for Thursday’s Brexit vote, and, yes, it’s my opinion we should do the same. Trying to fight and trade a directionally challenged market is just unproductive.
For the last four months, the SPY has traveled sideways in a channel from about $203.85 up to about $212.52. We have a lateral support line drawn at $207.12 which the Bulls currently have the pleasure of owning. As long as the Bulls can maintain ownership above $207.12, they should stay the favorite. Weakness below $207.12, and the sellers will become the favorite.
Be careful out there. The game for the next couple of days will simply be bumper cars. Remember the ticker symbol I shared with you last week that could be the most important ticker symbol of all time?
C…ash
I…is
A…a
P…osition
All the best to your trading success!
Rick | Hit and Run Candlestick Team
Trading knowledge ignites successful stock trading.
Continue Reading
Rick’s Featured Trade Ideas
Today’s featured trade idea and my personal trade plan
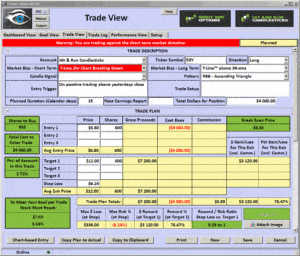
SGY/Long | RBB| Ascending Triangle
 SPY: T-Line™ Chart: Needs confirmation
Good Morning, Profit Traders,
Last week I talked about the 34-EMA and the T-Line™ and how I use them together. The T-Line is still above the 34-EMA on the SPY, but the candlesticks are looking very weak as if they are about to let the T-Line™ drop below the 34-EMA.
Two intraday charts that I follow are the 2-hour and 4-hour charts, and on both, the T-Line™ has cut through the 34-EMA and now hangs below.
On the hourly chart, the T-Line™ is only above the 34-EMA because of yesterday’s gap, and it looks as if any weakness today will drop it back below the 34-EMA.
Price action on the 2-hour chart is suggesting that the Bulls are very vulnerable if they continue to hang out below $209.15. Below $207.15 and I’m afraid the Bulls will be in a headlock getting nooggies from the bears.
All the best to your trading success!
Rick | Hit and Run Candlestick Team
Trading knowledge ignites successful stock trading.
Continue Reading
Last Updated: June 20, 2016
Will you do me a favor? Picture a punt kick. A football player drops a ball, kicks it forcefully before it hits the ground, and then watches (along with crowds of cheering spectators) as the ball flies up toward the sky. Now, as you try to identify and memorize the Bullish Kicker candlestick pattern, use that image as a reference. Somewhat like a punt kick, the price drops down and then kicks back up with a gap forming between the first and second candle (i.e., the grass and the ball), indicating an abrupt change in sentiment. To learn more about this kicky candlestick signal, please scroll down . . .
Continue Reading
Rick’s Featured Trade Ideas
Today’s featured trade idea and my personal trade plan
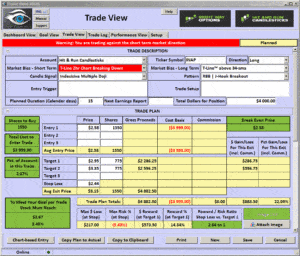
INAP/Long | RBB| Bullish J-Hook | PBO Support
 SPY: T-Line™ Chart: Needs confirmation
Good Morning, Profit Traders,
Let’s take a look at Friday’s close, Friday’s low was within pennies of a tweezer bottom but more importantly the low was higher than the low Thursday. Friday’s candle closed within Thursday’s candle making it an inside day. Friday’s candle close the gap of May 24.
Based on the morning futures that the Bulls seem to have had a team meeting this weekend and decided they were going to take on the bears $210.95 which may lead to challenging the June 8 high.
At the close Friday the T-Line™/34 EMA trend was still intact. If the Bulls are successful with follow-through $214.00 and $217.00 are possible bullish direction
All the best to your trading success!
Rick | Hit and Run Candlestick Team
Trading knowledge ignites successful stock trading.
Continue Reading
Rick’s Featured Trade Ideas
Today’s featured trade idea and my personal trade plan
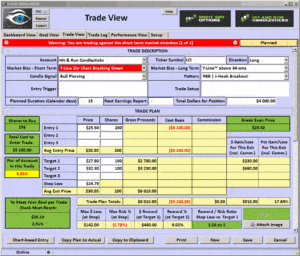
LCI/Long | RBB| Bullish J-Hook | Cup & Handle
 SPY: T-Line™ Chart: Needs confirmation
Good Morning, Profit Traders,
Yesterday the market went from an oversold low to a high with an impressive price action candlestick. The SPY in particular went from a low to a high with nearly a three point move in the candle pattern painting a bullish piercing candle and a candle in the belt-hold family. Here at Hit-And-Run Candlesticks and Right Way Options, we realize that price action/candlesticks require confirmation.
Despite the good price action yesterday, one would have thought that we could see a trend reversal in our intraday charts, but we did not. This should cause the savvy trader to have some concern or at least patience until we see the intraday charts with a bullish trend.
There are two major numbers that the Bulls need to capture: $209.36 and $210.15. This may not happen unless the intraday charts see a meaningful constructed bottom. Many times yesterday I pointed to a 30-minute chart and the fact that the T-Line™ was still below the 34 EMA. It would be a win for the Bulls if they could produce enough energy to drag the T-Line™ back above the 34-EMA; unless this happens, the bears stay in charge.
All the best to your trading success!
Rick | Hit and Run Candlestick Team
Trading knowledge ignites successful stock trading.
Continue Reading
 SPY: T-Line™ Chart: teetering between Bullish and Bearish


