Rick’s Featured Trade Ideas
No trade ideas today, we should all have plenty on our watch list
Good Morning, Profit Traders,
The T-Line™ is a powerful timing indicator!
When following candlesticks/price action and chart patterns, one can clearly see the market is not doing very well, and as we all know, major news events will trump everything, meaning, if the market likes what comes out of Jackson Hole, this market could jump and fly higher. Of course, it could also turn very ugly. Today, it is very possible we have a major news event coming out of Jackson Hole.
We still have an Evening Star Double Top and Support at the $217.-7ish level. This narrow range we have been in tells me ALL traders/investors are waiting for a clue.
All the best to your trading success!
Rick | Hit and Run Candlestick Team
Trading knowledge ignites successful stock trading.
————————————————-
Members Daily Trade Ideas,
No Trade Ideas Today
These are the stocks I put on my watch list to trade. I focus on these stocks for Swing Trades and the potential 10% – 40% gains. You must follow your trading rules for entry stops, profits or loses. Remember to check for earnings!
Keep your eye on the inverse ETF’s They trade well!
Continue Reading
Rick’s Featured Trade Ideas
Today’s featured trade idea and my personal trade plan
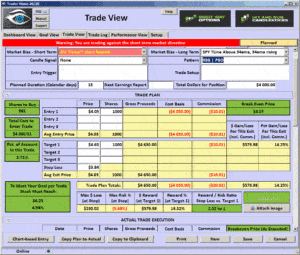
OZM | RBB | PBO |On Support
Double click the trade plan to enlarge
 Good Morning, Profit Traders,
The T-Line™ is a powerful timing indicator!
The SPY had bearish follow through yesterday on a failed high from the day before. Previous support has been $217.07ish only time will tell if it remains support. The SPY currently has 2 bearish shooting starts about a week apart, a trader just has to be concerned, (I know I am).
Many of the members have gone to cash or working themselves closer to cash. We all know that Jennet Yellen and Jackson Hole will play a big part in the future market direction and the SMART traders knows not to front run the news.
My friends there are times to be trading like a mad man and there are times to sit back and watch. What time is for you?
The 2 weakest sectors were Healthcare and Basic Materials and no sectors that lead the previous day.
All the best to your trading success!
Rick | Hit and Run Candlestick Team
Trading knowledge ignites successful stock trading.
————————————————-
Members Daily Trade Ideas,
Reserved for Members Only
These are the stocks I put on my watch list to trade. I focus on these stocks for Swing Trades and the potential 10% – 40% gains. You must follow your trading rules for entry stops, profits or loses. Remember to check for earnings!
Keep your eye on the inverse ETF’s They trade well!
Continue Reading
Rick’s Featured Trade Ideas
Today’s featured trade idea and my personal trade plan
OZM | RBB | PBO |On Support
Double click the trade plan to enlarge
 Good Morning, Profit Traders,
The T-Line™ is a powerful timing indicator!
The SPY had bearish follow through yesterday on a failed high from the day before. Previous support has been $217.07ish only time will tell if it remains support. The SPY currently has 2 bearish shooting starts about a week apart, a trader just has to be concerned, (I know I am).
Many of the members have gone to cash or working themselves closer to cash. We all know that Jennet Yellen and Jackson Hole will play a big part in the future market direction and the SMART traders knows not to front run the news.
My friends there are times to be trading like a mad man and there are times to sit back and watch. What time is for you?
The 2 weakest sectors were Healthcare and Basic Materials and no sectors that lead the previous day.
All the best to your trading success!
Rick | Hit and Run Candlestick Team
Trading knowledge ignites successful stock trading.
————————————————-
Members Daily Trade Ideas,
Symbols from TC2000
HTBX
HLTH
EVRI
PBF
ALJ
RRTS
PAG
REI
OZM
CLMT
RH
CPST
These are the stocks I put on my watch list to trade. I focus on these stocks for Swing Trades and the potential 10% – 40% gains. You must follow your trading rules for entry stops, profits or loses. Remember to check for earnings!
Keep your eye on the inverse ETF’s They trade well!
Continue Reading
Rick’s Featured Trade Ideas
Today’s featured trade idea and my personal trade plan
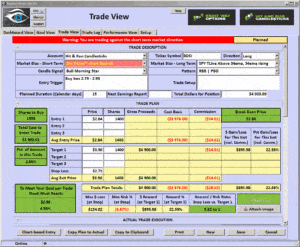
BDSI | RBB | PBO | J-Hook
Double click the trade plan to enlarge
 Good Morning, Profit Traders,
The T-Line™ is a powerful timing indicator!
The Bulls were able to close the SPY over $218.90 on a very unfriendly candle. We now have a Shooting Star that is still active and a double top with what could end up being another Shooting Star.
I think the market will be a bit crazy and unpredictable till we hear the outcome of the Jackson Hole Fed meetings. It is very hard to be a super bull or a super bear right now.
All the best to your trading success!
Rick | Hit and Run Candlestick Team
Trading knowledge ignites successful stock trading.
————————————————-
Members Daily Trade Ideas,
Reserved for Members only
These are the stocks I put on my watch list to trade. I focus on these stocks for Swing Trades and the potential 10% – 40% gains. You must follow your trading rules for entry stops, profits or loses. Remember to check for earnings!
Keep your eye on the inverse ETF’s They trade well!
Continue Reading
Rick’s Featured Trade Ideas
Today’s featured trade idea and my personal trade plan
BDSI | RBB | PBO | J-Hook
Double click the trade plan to enlarge
 Good Morning, Profit Traders,
The T-Line™ is a powerful timing indicator!
The Bulls were able to close the SPY over $218.90 on a very unfriendly candle. We now have a Shooting Star that is still active and a double top with what could end up being another Shooting Star.
I think the market will be a bit crazy and unpredictable till we hear the outcome of the Jackson Hole Fed meetings. It is very hard to be a super bull or a super bear right now.
All the best to your trading success!
Rick | Hit and Run Candlestick Team
Trading knowledge ignites successful stock trading.
————————————————-
Members Daily Trade Ideas,
TRXC
RRC
PMTS
OCN
NK
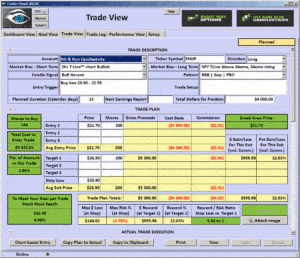
ENDP
WAC
SIG
CLMT
BW
BDSI
These are the stocks I put on my watch list to trade. I focus on these stocks for Swing Trades and the potential 10% – 40% gains. You must follow your trading rules for entry stops, profits or loses. Remember to check for earnings!
Keep your eye on the inverse ETF’s They trade well!
Continue Reading
Rick’s Featured Trade Ideas
Today’s featured trade idea and my personal trade plan
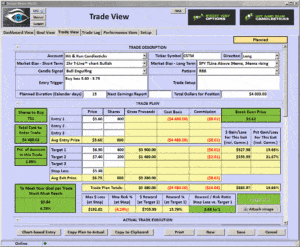
CSTM | Bullish Engulf
Double click the trade plan to enlarge
 Good Morning, Profit Traders,
The T-Line™ is a powerful timing indicator!
“Once you attach an assumption to a piece of evidence, you start to bend the narrative to support it.” $218.90 remains the number for the bulls to beat in this slow grind up. The Feds are not likely to raise rates any time soon and the market loves that idea. Yesterday, the bulls held price over the T-Line™. A close above $218.90 today could be the start of the next leg up, barring any bad news. Until the recent Shooting Star is dismissed by the bull, it is still a threat.
Yesterday we heard from one of our members that for the past six months, he has launched his account by 54%! That’s FANTASTIC!
All the best to your trading success!
Rick | Hit and Run Candlestick Team
Trading knowledge ignites successful stock trading.
————————————————-
Members Daily Trade Ideas,
Reserved for Members Only
These are the stocks I put on my watch list to trade. I focus on these stocks for Swing Trades and the potential 10% – 40% gains. You must follow your trading rules for entry stops, profits or loses. Remember to check for earnings!
Keep your eye on the inverse ETF’s They trade well!
Continue Reading
Rick’s Featured Trade Ideas
Today’s featured trade idea and my personal trade plan
BDSI | RBB | PBO | J-Hook
Double click the trade plan to enlarge
 Good Morning, Profit Traders,
The T-Line™ is a powerful timing indicator!
Friday I wrote, “The real test for the buyers is if they can close up above $218.60.“ This was for the very near term. The buyers failed to close over $218.60. Last week I warned about the Bearish Shooting Star on the daily chart and the Bearish Island Reversal on the intraday charts. These are warning signs that the bull may be getting tired and in need of a rest. A test of the $217.02 low is still possible, followed by the 34 ema area. A breakout over $218.90 would put new life in the bull run. The outcome of Jackson Hole will likely play a part in how the market finishes up this week.
All the best to your trading success!
Rick | Hit and Run Candlestick Team
Trading knowledge ignites successful stock trading.
————————————————-
Members Daily Trade Ideas, we might also want to keep or eye on a few shorts or inverse ETF’s
Members Only, Members trade ideas can be found in the members area
These are the stocks I put on my watch list to trade. I focus on these stocks for Swing Trades and the potential 10% – 40% gains. You must follow your trading rules for entry stops, profits or loses. Remember to check for earnings!
Keep your eye on the inverse ETF’s They trade well!
Continue Reading
Rick’s Featured Trade Ideas
Today’s featured trade idea and my personal trade plan
BDSI | RBB | PBO | J-Hook
Double click the trade plan to enlarge
 Good Morning, Profit Traders,
The T-Line™ is a powerful timing indicator!
Friday I wrote, “The real test for the buyers is if they can close up above $218.60.“ This was for the very near term. The buyers failed to close over $218.60. Last week I warned about the Bearish Shooting Star on the daily chart and the Bearish Island Reversal on the intraday charts. These are warning signs that the bull may be getting tired and in need of a rest. A test of the $217.02 low is still possible, followed by the 34 ema area. A breakout over $218.90 would put new life in the bull run. The outcome of Jackson Hole will likely play a part in how the market finishes up this week.
All the best to your trading success!
Rick | Hit and Run Candlestick Team
Trading knowledge ignites successful stock trading.
————————————————-
Members Daily Trade Ideas, we might also want to keep or eye on a few shorts or inverse ETF’s
Symbols from TC2000
VNCE
CRMD
MEMP
STKL
FIVN
BDSI
EGRX
CLMT
OCUL
CLVS
GPRO
LC
These are the stocks I put on my watch list to trade. I focus on these stocks for Swing Trades and the potential 10% – 40% gains. You must follow your trading rules for entry stops, profits or loses. Remember to check for earnings!
Keep your eye on the inverse ETF’s They trade well!
Continue Reading


