UEC Broke Out With A T-Line Run
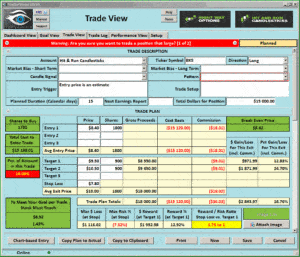
(Uranium Energy Corp) $UEC broke out with a T-Line Run and finished Friday with a Bullish Morning Star. Step back, and you can see a Bullish Inverted Head and Shoulder in the chart. Using the 3-day chart, you can see a Bullish Cup and Handle. UES could be set up to challenge the 2015 High’s
Learn more about Hit and Run Candlesticks, and today’s trade idea plus the 10 or more members trade ideas, starting at 9:10 EST AM every morning. Every day we teach and trade using the T-Line, Candlesticks, Support and Resistance, Trends, chart patterns and continuation patterns.
Our 3 biggest holdings are IPI and ARDX and HIIQ
Education on how to manage a trade from start is key yo Swing Trading wealth.
With on-demand recorded webinars, eBooks, and videos, member and non-member eLearning, plus the Live Trading Rooms, there is no end your trading education here at the Hit and Run Candlestick, Right Way Option, Strategic Swing Trade Service and Trader Vision.
$OZM was first presented to HRC members on June 5,
Now up 28.10% with a run of 8.39% Friday. Many of our members are being rewarded for there for their education and understanding of how a trade is managed. Great Job!!
Eyes On The Market
The SPY had .47% day which was enough to close at a new high $245.56; the Bulls have had a fun few days with the gap and 3 days of follow through.
What is a Trade Idea Watch-list?
A trade idea watchlist is a list of stocks that we feel will move in our desired direction over a swing trader’s time frame. That time could be one to 15 days for example. From that watchlist, we wait until price action meets our conditions for a trade.
MEMBERS ONLY
Investing and Trading involve significant financial risk and are not suitable for everyone. No communication from Hit and Run Candlesticks Inc. is financial or trading advice. All information is intended for Educational Purposes Only. Terms of Service.
Rick Saddler is not a licensed financial adviser nor does he offer trade recommendations or advice to anyone except for the trading desk of Hit and Run Candlesticks Inc.
Third Quarter Earnings craziness begins today!
With the beginning of the third quarter earnings today I’m hopeful we will finally shake lose from the choppy range bound price action of late. Please, please make a habit of checking current holdings and possible new trades for earnings reports. Getting caught by surprise is not acceptable for professional traders. I think this round of earnings will be very important. We have had an amazingly bullish market since the presidential election. It will now be up to the companies to prove with their results that current high prices of the market are justified by earnings results. Stay on your toes there are likely volatile days ahead.
On the Calendar
We kick off the Calendar with big reports this Friday morning. First the Consumer Price Index at 8:30 AM Eastern followed immediately by the Retail Sales report. Shortly after at 9:15 is the Industrial Production report. We have a Fed Speaker at 9:30 than the less important Business Inventories and Consumer Sentiment report. Consensus expects a 0.1% gain in the CPI, Retail Sales a weak 0.1% gain and a solid showing in Industrial Production of 0.2% increase. The Business Inventories are expected to grow 0.3% while Consumer Sentiment should remain but strong but decline slightly.
We get a running start on the 3rd quarter Earnings Calendar today with reports from C and JPM before the bell. How the big bank’s report will likely have a major effect on how the market open today. Over all, there are 14 companies reporting earnings today.
Action Plan
Yesterday price action was just what the doctor ordered with the Bulls stepping up to the plate and following through on Wednesday’s strong performance. Although the price action was bullish, the SPY, IWM and QQQ’s continue to overhead resistance yet to deal with so don’t sound the All Clear signal just yet.
With so much big data coming out before the market opening today anything is possible, so we will have to think on our feet. Currently, the futures are flat as the market waits for the deluge of news. As a result, I will need to remain flexible and closely focus on the price action at the open before making decisions on new positions. Of course, the first order of business is to manage current positions. Friday, as you know, is normally the day I look to bank some profits rather than entering new trades. However, with the overall market showing signs of shaking off the range bound chop, I will not rule out new trades today.
[button_2 align=”center” href=”https://youtu.be/iGUt1IGhp9w”]Morning Market Prep Video[/button_2]
Trade Wisely,
Doug
MVIS Broke out of a Bullish W Pattern
(Microvision Inc) $MVIS broke out of a Bullish W Pattern with a strong 20% candle after a double bottom. Then on the 2-Day chart rested for four bars followed by a Bullish Morning Star and Bullish Follow through, while holding a T-Line Run for 8 bars.
Learn more about Hit and Run Candlesticks, and today’s trade idea plus the 10 or more members trade ideas, starting at 9:10 EST AM every morning. Every day we teach and trade using the T-Line, Candlesticks, Support and Resistance, Trends, chart patterns and continuation patterns.
We are still holding IPI +15.95 ARDX +24.74%
Education on how to manage a trade from start to finish is vital to a swing traders success.
With on-demand recorded webinars, eBooks, and videos, member and non-member eLearning, plus the Live Trading Rooms, there is no end your trading education here at the Hit and Run Candlestick, Right Way Option, Strategic Swing Trade Service and Trader Vision.
$HTZ was first presented to HRC members on June 29,
Now up 35.52% with a run of 15.75% yesterday. Many of our members took ½ off the table yesterday and raised the stop on the second ½. -Good Trading
Eyes On The Market
As of the close yesterday the Bulls are still winning the game but getting tired and maybe needing a little rest. Maybe just a rest back to support.
What is a Trade Idea Watch-list?
A trade idea watchlist is a list of stocks that we feel will move in our desired direction over a swing trader’s time frame. That time could be one to 15 days for example. From that watchlist, we wait until price action meets our conditions for a trade.
MEMBERS ONLY
Investing and Trading involve significant financial risk and are not suitable for everyone. No communication from Hit and Run Candlesticks Inc. is financial or trading advice. All information is intended for Educational Purposes Only. Terms of Service.
Rick Saddler is not a licensed financial adviser nor does he offer trade recommendations or advice to anyone except for the trading desk of Hit and Run Candlesticks Inc.
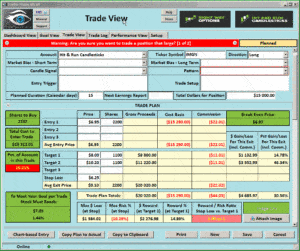
With C reporting earnings before the market opens tomorrow I suggest taking profits on the trade to avoid the risk. I would like to have held the trade through earnings but there is just not enough cushion in profits to hold it. You should realize about 20% gain in the trade. Well done!
Bullish price action is very important today.
Yesterday the Bulls came out to play, but they left behind a price action gap that requires a defensive plan today. The one day pop was fantastic with many of us banking some tasty profits yesterday. However, if the Bulls fail to defend the gap, I fear the confidence felt by the market yesterday will quickly erode. So get out your pom-poms and cheer for the Bulls. If we see the index prices slip into the gap prepared for the possibility of a quick selloff to fill the gap. Keep in mind that as good as yesterday was the SPY, QQQ’s and IWM are still under resistance levels that have proved to be difficult to breach.
On the Calendar
Thursdays Economic Calendar begins with the weekly Jobless Claims at 8:30 AM Eastern followed directly by the PPI numbers. Labor demand remains strong, and the jobless numbers are expected to continue that trend with forecasters expecting a 246k print this week. PPI, on the other hand, has remained rather soft coming in a 0.3% in May with consensus expecting only 0.2% in June. A great number in regards to inflation but not so much for the Labor force wages that continue to be flat. At 9:30 AM round two with Janet Yellen begins before the Banking Committee in Washington. Whatever she said yesterday seemed to inspire the Bulls, so let’s hope sentiment remains the same today.
On the Earnings Calendar, we have 22 companies expected to report today. Among them is Delta Airlines which I am curious to see because of the sharp rise we have seen in airline stocks this quarter. DAL reports before the bell today.
Action Plan
The Bulls came out to play yesterday and stuck by enthusiasm all day. The SPY and the QQQ’s faired the best holding up well the entire day. The Bears were at work on the IWM and the DIA as we headed into the close but all in all the Bulls held their ground pretty darn well. Because we left a price gap behind it will be very important that the Bulls keep up their efforts following through today. Currently, futures are pointing to a higher open, but we will need to see how buyers react after the open. A pullback that fills the gap I believe would damage confidence in this rally reinforcing the resistance levels. So get-R-done Bulls!
All of our RWO positions did well yesterday and taking a one day gain +20% gain on BABA was a nice bonus. I wish we didn’t have to, but I think think it’s prudent to that we take profits in C today ahead of the Friday earnings. This trade performed very well, but there is just not enough cushion in the profits to safely hold through the earnings report. So, l will be taking the 20% gain in C today and suggest member do the same.
[button_2 color=”green” align=”center” href=”https://youtu.be/hOcLjIjc7Q4″]Morning Market Prep Video[/button_2]
Trade Wisley,
Doug
P Is Building A J-Hook Continuation Pattern
(Pandora Media Inc) $P is building a J-Hook continuation pattern after a 8 day run to the 50-sma. The pullback ended with a Bullish Engulf, the follow through ended yesterday with a Doji, now creating a Doji Continuation pattern. Other patterns and signal involved are Inverse Head and Shoulder, POB to the 38% Fib line. 2-day chart is supporting a Bullish Morning Star Signal
Learn more about Hit and Run Candlesticks, and today’s trade idea plus the 10 or more members trade ideas, starting at 9:10 EST AM every morning. Every day we teach and trade using the T-Line, Candlesticks, Support and Resistance, Trends, chart patterns and continuation patterns.
We are still holding ARDX 22.64% profit
Education on how to manage a trade from start to finish is vital to a swing traders success.
With on-demand recorded webinars, eBooks, and videos, member and non-member eLearning, plus the Live Trading Rooms, there is no end your trading education here at the Hit and Run Candlestick, Right Way Option, Strategic Swing Trade Service and Trader Vision.
[button_1 text=”%2485.00%20a%20Month%20Cancel%20Anytime%20-%20Keep%20what%20you%20learn%20and%20you%20will%20learn%20a%20lot” text_size=”27″ text_color=”#000000″ text_bold=”Y” text_letter_spacing=”0″ subtext_panel=”Y” subtext=”Take%20A%20Look” subtext_size=”19″ subtext_color=”#f40606″ subtext_bold=”Y” subtext_letter_spacing=”0″ text_shadow_panel=”N” styling_width=”40″ styling_height=”30″ styling_border_color=”#000000″ styling_border_size=”1″ styling_border_radius=”6″ styling_border_opacity=”100″ styling_shine=”Y” styling_gradient_start_color=”#ffff00″ styling_gradient_end_color=”#ffa035″ drop_shadow_panel=”N” inset_shadow_panel=”N” align=”center” href=”https://hitandruncandlesticks.com/hit-and-run-candlesticks/” new_window=”Y”/]
$SPWR was first presented to HRC members on May 31
Now up 24.66%. And popped 12.39% yesterday. SPWR was a Rounded Bottom Breakout and nailed it by the numbers on the daily chart. The 2-day chart is still a Rounded Bottom Breakout pattern, and it looks like another 25% is in the sun.
Eyes On The Market
Yesterday the market loved everything about Miss Janet, will today be the same? Price gapped and held above the downtrend line on the SPY turning the T-Line back up. Stay cautious and let’s make money.
What is a Trade Idea Watch-list?
A trade idea watchlist is a list of stocks that we feel will move in our desired direction over a swing trader’s time frame. That time could be one to 15 days for example. From that watchlist, we wait until price action meets our conditions for a trade.
MEMBERS ONLY
Investing and Trading involve significant financial risk and are not suitable for everyone. No communication from Hit and Run Candlesticks Inc. is financial or trading advice. All information is intended for Educational Purposes Only. Terms of Service.
Rick Saddler is not a licensed financial adviser nor does he offer trade recommendations or advice to anyone except for the trading desk of Hit and Run Candlesticks Inc.