Charts Have Been Mean And Green
 Wow, what a great week this has been, the charts have been mean and GREEN, and we love GREEN. Hey, thanks to all the members for posting and sharing the great charts. I see the morning futures are a looking a bit weak this morning, let’s keep our eye on the ball and the trend, using a couple of support and resistant lines can make all the difference in the world.
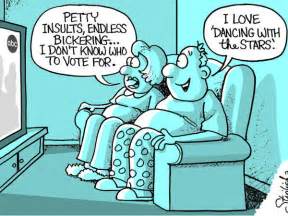
The DC politics is something I dislike, but we have to keep our eyes and ears open on whats going on and trade the charts based on the charts, not hopes and dreams.
►NewsFrom Our Team
Trader Vission 2020.2 is nearly ready to be launched; the testers have been testing it for about two months now. We are extremely confident that Trader Vission is a must-have tool for the trader that wants the next level of success.
How to save your membership cost – This project will be ready before Christmass, and one of the benefits is it will pay for all your membership cost or at least the largest portion. It is very important to the HRC/RWO team that you receive quality at the very best possible price.
►Sample • Members Recent Big Winners
EGLT 16.8% • WIN 28.9% • HOV 24.45% • ZUMZ 30% • URBN 21.20% • ARNA 21.5
► Eyes On The Market
In the past 11 bars, the SPY has gone from below the Lower T-Line and with a Bullish Morning Star price ran nearly 3.8%. All of our moving trend lines are still bullish. Price has gotten a bit overzealous and extended. I believe we are very close to seeing a little correction or at least price needs to be taken down a notch or two.
Rick’s trade ideas for the day – MEMBERS ONLY
30-Day Trial • Monthly • Quarterly • Semi-Annual • Annual
Investing and Trading involves significant financial risk and is not suitable for everyone. No communication from Hit and Run Candlesticks Inc. is financial or trading advice. All information is intended for Educational Purposes Only. Terms of Service.
Rick Saddler is not a licensed financial adviser nor does he offer trade recommendations or advice to anyone except for the trading desk of Hit and Run Candlesticks Inc.
Gap Back In October and Consolidated
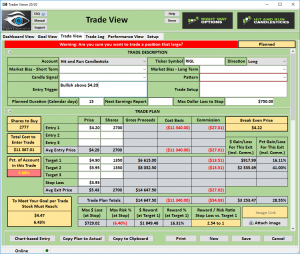
 RIGL – Gapped back in October and had consolidated for the past two months. The 34-EMA has caught up with the price. A few days ago price popped and is now seeing a little profit taking. The weekly chart shows good strong support and a Bullish Morning Star signal. You can also see the Bullish “W” pattern. I see a leg or 2 putting price around $7.00 with plenty of swing zones in between.
Good Trading – Hit and Run Candlesticks
► Must Read • Trade Update (VIAB)
On November 20 we shared and covered in detail the technical properties of VIAB in the Trading Room, Yesterday the profits were about 8.7% or $227.00, with 100 shares. VIAB broke of a Bullish J-Hook continuation pattern within a Rounded Bottom Breakout setup.
[button_2 color=”red” align=”center” href=”https://hitandruncandlesticks.com/hrc-rwo-30-day-offer/” new_window=”Y”]In 30-Days Learn and Profit From Hit and Run Candlesticks [/button_2]
► Eyes On The Market
I had a few concerns going into the close yesterday with the QQQ’s and SMA getting crushed, and I am still very concerned. This morning the futures a bit positive and the Transports (IYT) smacked the cover off the ball yesterday. Overall I am still Bullish because the price of the SPY, IYT, and DIA are still trending above the T-Lines. Following price on the 1, 2, and three-day charts and how price interacts with all 3 of the T-Lines has had a positive impact on myself and the members of Hit and Run Candlesticks and Right Way Options.
Rick’s trade ideas for the day – MEMBERS ONLY
30-Day Trial • Monthly • Quarterly • Semi-Annual • Annual
Learn how and what we trade: The T-Line • T-Line Bands • Support • Resistance • Buy Box • Volatility Stops • Price Action • Candlesticks • Profit Zones • Entry Zones • Protective Stops
Investing and Trading involves significant financial risk and is not suitable for everyone. No communication from Hit and Run Candlesticks Inc. is financial or trading advice. All information is intended for Educational Purposes Only. Terms of Service.
Rick Saddler is not a licensed financial adviser nor does he offer trade recommendations or advice to anyone except for the trading desk of Hit and Run Candlesticks Inc.
Washington DC Spin
 The US Senate is now the top focus of the market as the Tax Reform bill head to the floor for debate. According to reports, a vote could come before the end of business Friday. In my opinion, there is never a more dangerous time in the market then when Politicians, rhetoric and the Washington DC Spin machine is in control. Anything is possible, and high volatility and big intra-day swings can occur. Also, keep in mind that even after the Tax Reform dog and pony show is over we still face a Federal Government shutdown in early December. Who knows what kind of political drama that could create. I suggest if you do trade then trade small and stay on your toes because the price could be very bumpy the next couple weeks.
On the Calendar
The Thursday Economic Calendar begins at 8:30 AM Eastern with two important reports. First, the consensus for the Jobless Claims number this week is 240K vs. 239K on the previous reading. If not for the impacts of Puerto Rico Jobless Claims would be at or near historic lows. Second, is the Personal Income and Outlays report. Personal Income is see rising 0.3% while consumer spending could slow slightly to 0.3%. The Core index expects a 0.2% increase for a yearly rate fo 1.4%. Also at 8:30 AM we have a Fed Speaker and then another at 1:00 PM to pontificate on interest rates. At 9:45 AM is the Chicago PMI which forecasters are calling for a decline to 63.5 vs. 65.2.
On the Earnings Calendar, we have 38 companies reporting. Please continue to check current holdings as well as those you are considering for purchase for reporting dates. Just a few seconds of effort can save you from significant losses if a company reports poorly.
Acton Plan
Yesterday’s price action left behind patterns of uncertainty in the DIA, SPY, and IWM. The QQQ’s on the other hand, reminded us that the bears still exist and their teeth are very sharp! Many trends in the Tech sector broke down yesterday, and there are reversal patterns galore. As bad as it was, please remember it’s not the first move lower that matters. A failure to make a new high after it bounces is where the real selling could begin. The sky is not falling.
New out of Washington that the Senate voted mover the Tax Reform bill forward to floor debate has fired up the Futures this morning. Currently, the Dow futures are suggesting a large gap up at the open. Remember gaps to new market highs can create whipsaw price action producing fast intraday reversals. Be careful not chase and get caught up in the morning drama. A vote to pass the Tax bill could happen within the next 24 to 48 hours. If it happened to fail; well, use your imagination.
Trade Wisely,
Doug
[button_2 color=”green” align=”center” href=”https://youtu.be/uKqlLAM72s8″]Morning Market Prep Video[/button_2]
Tax Reform
 With the Tax Reform bill looking as if it will pass, markets thumbed their nose at North Korea. Who would have guessed that money trumps a threat of nuclear attack? With all this going one would have expected the VIX the have gone wild. Oddly enough the VIX barely moved the entire day! Futures markets want the party to continue this morning with Dow pointing to a gap up around 70 points. Anyone caught holding short positions yesterday got completely run over by stampeding bulls. A very good reminder that shoring an up-trending market is an unwise business decision. Stay with the trend but avoid the temptation to chase and consider taking profits into strength.
On the Calendar
The Economic Calendar starts off with the very important GDP report at 8:30 AM eastern. The 2nd estimate for the 3rd-quarter GDP is expected to come in higher at 3.3 vs. the 3.0 on the first reading. Oddly enough consumer spending is expected have nearly paused, up from 2.4% to only 2.5%. The overall GDP Pirce index is expected to remain unchanged at 2.2%. Janet Yellen speaks at 10:00 AM while the Pending Home Sales Index reports. Consensus expects a sharp rise of 1.0% in October pending home sales. At 10:30 AM is the EIA Petroleum Status report which they don’t estimate forward, but a recent pipeline problem may have decreased stockpiles. There is another Fed speaker at 1:50 PM followed by the Beige Book at 2:00.
On the Earnings Calendar, I see 49 companies reporting results today. TIF is one of the companies reports before the bell while LZB, HOME, JACK, and WDAY are among those reporting after the bell.
Action Plan
All four major indexes ignored the threat of a North Korean nuclear attack setting new record highs across the board. Amazing and just a little spooky is the fact that the VIX barely moved yesterday in response to such a strong rally. Very odd. Even the IWM pitched in yesterday showing nice energy as it reacted higher from price support. Logic would suggest after such a big move the market would take a rest, but currently, futures are pointing to a gap up of nearly 70 points! The surge in bullishness seems to be the direct result of the Tax Reform bill looking as if it will pass.
Thank goodness we stuck to our rules and continued to trade with the trend because we were nicely rewarded yesterday. Continue to trade long but please avoid chasing as this kind of wild bullishness can suddenly find profit takers. Remember the rule, take profits into strength!
Trade Wisley,
Doug
[button_2 color=”green” align=”center” href=”https://youtu.be/A10SlH1nmhY”]Morning Market Prep Video[/button_2]
Exploded With Price Action
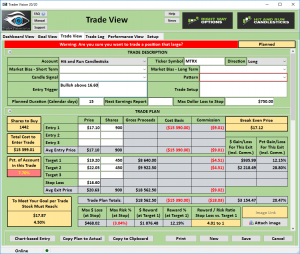
 MTRX – Challenged the September 27 high with an inside Pop Out O the Box pattern then exploded with price action. After a few days of consolidation and support, the current price action may now be ready for the next leg. Yesterday’s candle opened even with the previous days close and closed above the previous days open. The T-Lines and the 34-EMA have been trending very well. We love to see the candles stack.
Good Trading – Hit and Run Candlesticks
► Members’ Trade Idea Update (CAKE)
On October 18 we shared and covered in detail the technical properties of CAKE, today the profits would be about 9% or $396.00, with 100 shares. CAKE broke through the Dotted Duece yesterday in a Rounded Bottom Breakout pattern/strategy.
[button_2 color=”light-green” align=”center” href=”https://hitandruncandlesticks.com/hrc-rwo-30-day-offer/” new_window=”Y”]Trading Stocks For Extra Income? Or for A Living? CLICK ME[/button_2]
► Eyes On The Market
(SPY) No stinking missile is gonna mess with this market! The SPY • S&P500 closed at another new high. The SPY broke out from a Pop Out Of the Box patterns as it held above the T-Lines. Every day we have given me opportunities to trade great looking charts, it’s how we manage them that matters. As long as the bull keeps serving up perfectly cooked steaks, we’ll keep eating well.
Rick’s trade ideas for the day – MEMBERS ONLY
30-Day Trial • Monthly • Quarterly • Semi-Annual • Annual
Investing and Trading involves significant financial risk and is not suitable for everyone. No communication from Hit and Run Candlesticks Inc. is financial or trading advice. All information is intended for Educational Purposes Only. Terms of Service.
Rick Saddler is not a licensed financial adviser nor does he offer trade recommendations or advice to anyone except for the trading desk of Hit and Run Candlesticks Inc.
Learn how and what we trade: The T-Line • T-Line Bands • Support • Resistance • Buy Box • Volatility Stops • Price Action • Candlesticks • Profit Zones • Entry Zones • Protective Stops
 Wow, what a great week this has been, the charts have been mean and GREEN, and we love GREEN. Hey, thanks to all the members for posting and sharing the great charts. I see the morning futures are a looking a bit weak this morning, let’s keep our eye on the ball and the trend, using a couple of support and resistant lines can make all the difference in the world.


