Pesky 50-SMA
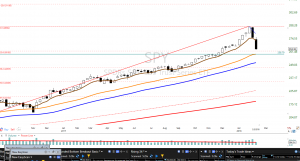
The market (SPY) ran into the pesky 50-SMA and was pushed away ending the day with a long wick at the top and a very small body. The candle formation “Inverted Hammer” is a sign the sellers outnumber the buyers unless something changes overnight there is a high probability the next day’s open is lower. The failure at the 50-SMA is a Blue Ice Failure pattern and requires a qualified bullish reversal pattern to challenge and overcome the 50-SMA.
The downtrend is still in play with $259.00 acting as support for now. Price has now drawn a low to a high and today will draw a lower low. Watch the chart for the next clue to a bullish bottom construction or soggy bottom fall out. Looking at the 4-hour chart, we might be drawing a higher low, with follow-through over and a test of the $271.60 area might encourage the buyers to take another run at the pesky 50-Sma
►Featured Trade Ideas
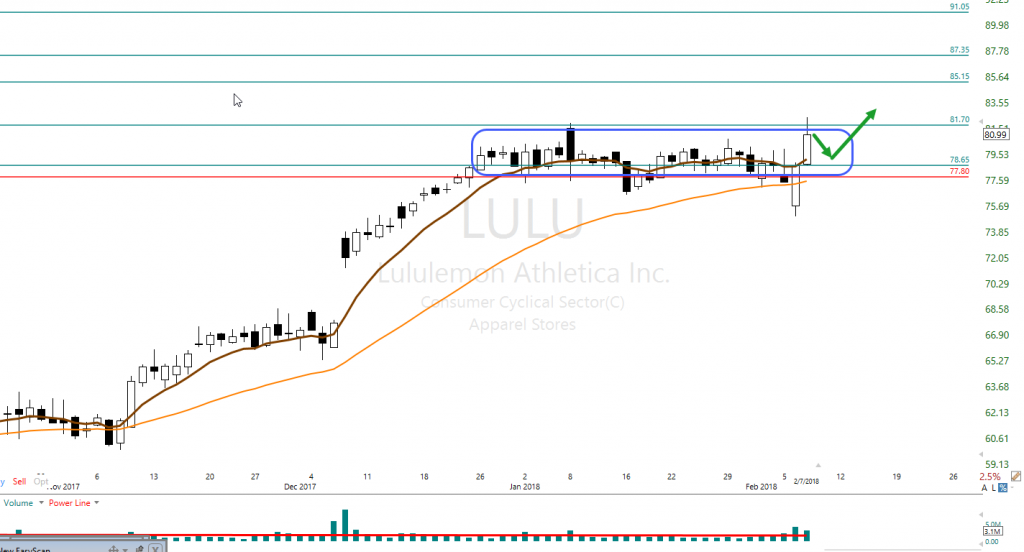
LULU printed a Bullish engulf two days ago and posted follow-through yesterday testing a multi-year high. LULU has the potential of reaching $100.00 or more. LULU has been trending and recently started to consolidate and has met a high number of our conditions for a possible trade. Learn more about how to trade this trade and others with Hit and Run Candlesticks starting at 9:10 ET in the live Trading Room #1
 [button_2 color=”blue” align=”center” href=”https://hitandruncandlesticks.com/hrc-rwo-30-day-offer/” new_window=”Y”]What would you spend to change your life?[/button_2]
►Learn the Power Of Simple Trading Techniques
On December 26, Rick shared WTW as a trade for members to consider and how to use the trading tools listed below. Currently, the profits could have been about 46% or $2345.00 with 100 shares. Using our Simple, Proven Swing Trade Tools and techniques to achieve swing trade profits.
Candlesticks • Price Action • T-Line • T-Line Bands • Support • Resistance • Trend • Trendlines • Chart Patterns • Buy Box • Volatility Stops • Profit Zones • Entry Zones • Protective Stops • RBB Rounded Bottom Breakout Strategy • Pop Out of The Box Strategy • Pinball Strategy • Trade Planning… Learn More
►The VXX short-term futures
The VXX is all over the place, the 200-SMA with a doji yesterday well above the downtrend line. While the VXX chart is in a bullish status, I do not believe it is not a buyable chart right now based on our terms.
►Rick’s Swing Trade ideas
Member Login – Full Trade List
30-Day Trial • Monthly • Quarterly • Semi-Annual • Annual
To learn more about our trading tools join us in the trading room or consider Private Coaching. Rick will help coach you to trading success.
Investing and Trading involve significant financial risk and is not suitable for everyone. No communication from Hit and Run Candlesticks Inc. is financial or trading advice. All information is intended for Educational Purposes Only. Terms of Service.
Rick Saddler is not a licensed financial adviser nor does he offer trade recommendations or advice to anyone except for the trading desk of Hit and Run Candlesticks Inc.
*************************************************************************************
Walking a Tightrope
 With price volatility high and potential failure patterns left behind, yesterday traders should be on high alert. It’s as if the market is walking a tightrope where just one misstep could lead to a quick and painful fall. At the close yesterday, the VIX was on the rise closing above 27 to display the rising trepidation of the current market conditions. Currently, the DIA, SPY, and QQQ charts have bearish failure patterns at the 50-day moving average. Personally, my hope is we can consolidate for several days to spill-off a bunch of this volatility but to ignore this pattern would be unwise.
On The Calendar
The Thursday Economic Calendar is full of non-market moving reports, bond events, and four Fed Speakers. The only market-moving report comes at 8:30 AM Eastern when the weekly Jobless Claims number release. Consensus expects claims to come in at 235,000 continuing to confirm strong labor demand.
On the Earnings Calendar, we have nearly 250 companies reporting. Before the bell today we will hear from CVS, PM K, TWTR, and YUM to name a few. After the bell reports from AIG, NVDA, ATVI, EXPE, SKX, and FEYE are a few keep traders on their toes.
Action Plan
Yesterday proved to be a choppy day of price action as the DIA, and SPY attempted to recover the 50-day moving average. Unfortunately, by the end of the day, they were unsuccessful, setting up a possible Blue Ice Failure Pattern. The QQQ also made a valiant attempt to hold the 50-day average only to give it up just slightly at the close. Surprisingly only the IWM managed to hold on to a positive close but remains the weakest of the 4-major indexes.
The VIX tried moving lower but finished the day above 27 suggesting market volatility will remain challenging. With the failures a the 50-day average its impossible to see anything other than a bearish pattern. Morning Futures are currently pointing to a lower open at least initially confirming a Blue Ice Failure pattern. However, there are a lot of earnings reports this morning that could improve or make worse the situation. Combine the bearish pattern with high volatility, and the conditions for a perfect storm exist. I recommend extreme caution as we head toward the weekend.
Trade Wisely,
Doug
[button_2 color=”green” align=”center” href=”https://youtu.be/0sSjz7yh66k”]Morning Market Prep Video[/button_2]
High Volatility
 After the very choppy morning session, Mr. Market finally got it together to deliver some sweet relief. I wanted to believe the big swings were over but I stuck to my rules choosing to wait for proof of support. The Dow Futures moved from 250 points down to nearly flat in just one hour this morning. Such high volatility can produce false signals and violent reversals. I’m glad I have developed some discipline in my old age and decided now to chase yesterday. Remember. just like the Grinch, Mr. Market can be a Mean One.
The VIX pulled back yesterday due to the late afternoon rally, but it still closed above a 30 handle. That would suggest that there is still considerable fear and violent gaps and price reversals are very likely. For the last couple years, the market was very forgiving, but for now, that has changed. If your chaise or try to predict a bottom, a punishing lesson in discipline is now a possible result.
On the Calendar
The Economic Calendar has a parade of Fed Speakers to pontificate on interest rates. Kaplan spoke at 6:00 AM, Dudley at 8:30 AM, Evans at 11:15 AM and Willams will finish the day at 5:30 PM. The important report of the day is the 10:30 AM EIA Petroleum Status report.
On the Earnings Calendar, we have nearly 200 companies reporting today. Combine a bunch of earnings with an emotional market, and anything is possible so stay on your toes.
Action Plan
At 6:00 AM Eastern the Dow Futures pointed about a 250 point gap down. By 6:00 AM Futures had recovered to an almost even open which suggest there is still a lot of risk due to huge emotional volatility. The relief rally was, of course, wonderful yesterday afternoon but keep in mind the VIX closed above a 30 handle.
I expect volatility to continue to produce fast price action and whipsaws. False signals and head-fakes are very common. Even the best of signals can quickly evaporate in this environment. I continue to recommend extreme caution and remember the lows could see another test. New and inexperienced traders should consider remaining on the sidelines until the price action slows back down. If you do decide to trade, I suggest trading smaller than normal positions. Don’t get caught up in the drama. Stick to your rules and matain your discipline.
Trade Wisely,
Doug
[button_2 color=”green” align=”center” href=”https://youtu.be/0iyLNErSfYU”]Morning Market Prep Video[/button_2]
Still Closing Below, The T-Line
The market (SPY) came back a little yesterday still closing below the T-Line and ALL moving averages that concerning for swing traders. Right now, I do not believe the SPY is showing signs of total collapse, but it has been damaged. The damage requires a constructed bottom that creates support for price action. Yesterdays low may act as support, but we need a few days to prove that. (Proof is better than prediction). A close below yesterdays low or the Dotted Deuce will likely cause a test of the 200-SMA.
►Featured Trade Ideas
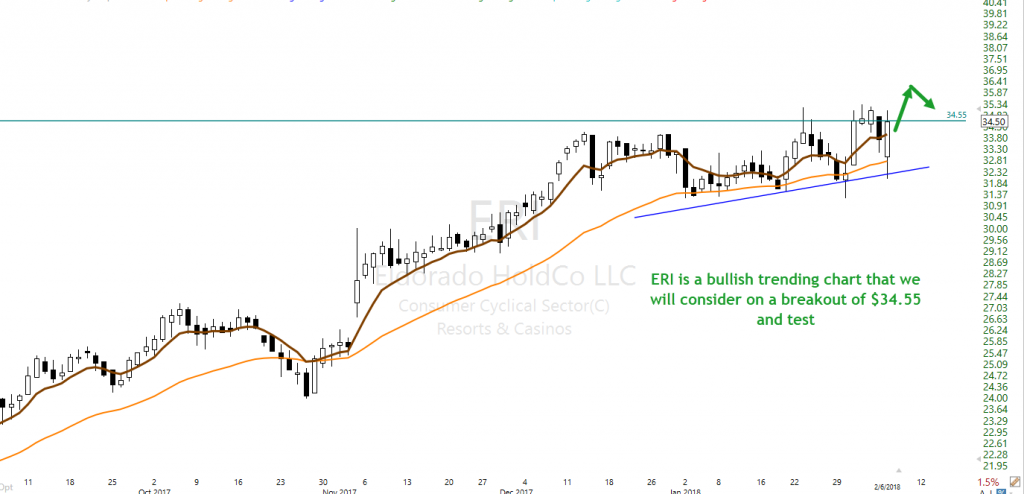
ERI is a multi-month trend with the big three moving averages close and tight. Price is showing signs of strength even with the recent sell-off. Learn more about trading this trade and others in the live morning prep 9:10 AM ET, in Room #1

►Learn the Power Of Simple Trading Techniques
On January 9, Rick shared ARRY as a trade for members to consider and how to use the trading tools listed below. Currently, the profits could have been about 29% or $369.00 with 100 shares. Using our Simple, Proven Swing Trade Tools and techniques to achieve swing trade profits.
Candlesticks • Price Action • T-Line • T-Line Bands • Support • Resistance • Trend • Trendlines • Chart Patterns • Buy Box • Volatility Stops • Profit Zones • Entry Zones • Protective Stops • RBB Rounded Bottom Breakout Strategy • Pop Out of The Box Strategy • Pinball Strategy • Trade Planning… Learn More
►The VXX short-term futures
The VXX is all over the place, closed above the 200-SMA and down yesterday. A tradeable chart pattern needs to be formed before we trade it again.
►Rick’s Swing Trade ideas
Member Login – Full Trade List
30-Day Trial • Monthly • Quarterly • Semi-Annual • Annual
Learn more about coaching with Rick Private Coaching.
Investing and Trading involve significant financial risk and is not suitable for everyone. No communication from Hit and Run Candlesticks Inc. is financial or trading advice. All information is intended for Educational Purposes Only. Terms of Service.
Rick Saddler is not a licensed financial adviser nor does he offer trade recommendations or advice to anyone except for the trading desk of Hit and Run Candlesticks Inc.
*************************************************************************************
The Good, The Bad and The Ugly
 Can we go back to 2017? So far 2018 has tossed at us The Good, The Bad and The Ugly in the time span of just over one month. The Good, record highs and tremendous bullishness for the first 25 days of the year. The Bad, last Friday’s nasty selloff of nearly 700 Dow points. The Ugly, yesterdays record-breaking one-day selloff that wiped out all the progress for the year and then some. So what happened?
Fear got a little out of control yesterday as the market watched Bond Yields rising rapidly and topping 2.8% by the close. The market has also suddenly become hyper-aware of inflation and what that might mean for interest rates going forward. As traders, we always try to compartmentalize the cause of such events to and make some sense of it all. But the truth is when markets are euphoric or panic-stricken, it rarely makes sense. Unfortunately this emotional roller coaster and last much longer than one would expect. The only way to protect yourself and your capital is to stand aside and let it pass.
On the Calendar
The Tuesday Economic Calendar kicks off with International Trade at 8:30 AM. Sadly the trade deficit is expected to widen sharply to $51.9 billion. At 10:00 AM the JOLTS report is looking for a slight gain to 5.900 million today according to consensus estimates. The is a Fed Speaker at 8:50 AM and some bound auctions to complete today’s calendar.
Today is a pretty big day on the Earnings Calendar with about 150 companies scheduled to fess up. Today, we will hear from GM, DNKN, DIS, GILD and CMG just to name a few.
Action Plan
Futures have been moving very quickly and all over the map during the overnight session. Around 11 PM last night Dow Futures were down nearly 900 points. By 4:00 AM they were up more than 150 points but as I write this at 7:12 AM they are nearly 400. All the blood in the water has attracted the really big sharks. Whipped into a feeding frenzy, they will bite at anything, and we can expect this to last for a while. Little fish like retail traders are just chum in the water and stand very little chance of escaping if we’re in the water. Day’s, maybe even weeks of very challenging price action lie ahead. Get out and stay out of the water if you can.
Trade Wisely,
Doug
[button_2 color=”green” align=”center” href=”https://youtu.be/kzmiM0Myx1g”]Morning Market Prep Video[/button_2]
When Will The Selling Stop?
 At 6:30 AM EST this morning the SPY was sitting at $258.79, the big question today will be “When will the selling stop”? The simple answer is when the buyers get in the buying mood. If we open today near the $258.70 area, we will be at or near the. Dotted Deuce. Over my years of trading, I have used the Dotted Deuce and 200-SMA as profit zones, support and resistance. There is a very good chance we will see tradeable action around the Dotted Deuce and the 200-SMA. Remember to be patient and wait for the buy signals and chart setups.
About a week ago in the trading room, we spent some time talking about how the SPY was getting too far from the 50-SMA and that was not normal, something had to give. Now let’s consider the weekly chart and Fib lines. Note that last time the SPY was near the 200-SMA (Mid Feb. 2016). Set a Fib line on the lows and draw to the most recent high. The SPY is currently flirting around the 23.6 retracements. The point I am making is price has pulled much too far away from a major moving average like the 200-SMA for a long-term weekly chart.
►Learn the Power Of Simple Trading Techniques
On November 15, Rick shared ARNA as a trade for members to consider and how to use the trading tools listed below. Currently, the profits could have been about 55% or $1400.00 with 100 shares. Using our Simple, Proven Swing Trade Tools and techniques to achieve swing trade profits.
Candlesticks • Price Action • T-Line • T-Line Bands • Support • Resistance • Trend • Trendlines • Chart Patterns • Buy Box • Volatility Stops • Profit Zones • Entry Zones • Protective Stops • RBB Rounded Bottom Breakout Strategy • Pop Out of The Box Strategy • Pinball Strategy • Trade Planning… Learn More
►The VXX short-term futures
Have exploded hitting $60.00 plus pre-market this morning, note that is over the weekly 50-SMA.
Rick’s Swing Trade ideas
Member Login – Full Trade List
30-Day Trial • Monthly • Quarterly • Semi-Annual • Annual
►To learn more about our trading tools join us in the trading room or consider Private Coaching.
Investing and Trading involve significant financial risk and is not suitable for everyone. No communication from Hit and Run Candlesticks Inc. is financial or trading advice. All information is intended for Educational Purposes Only. Terms of Service.
Rick Saddler is not a licensed financial adviser nor does he offer trade recommendations or advice to anyone except for the trading desk of Hit and Run Candlesticks Inc.
*************************************************************************************
 [button_2 color=”blue” align=”center” href=”https://hitandruncandlesticks.com/hrc-rwo-30-day-offer/” new_window=”Y”]What would you spend to change your life?[/button_2]


