The Good, The Bad and The Ugly
 Can we go back to 2017? So far 2018 has tossed at us The Good, The Bad and The Ugly in the time span of just over one month. The Good, record highs and tremendous bullishness for the first 25 days of the year. The Bad, last Friday’s nasty selloff of nearly 700 Dow points. The Ugly, yesterdays record-breaking one-day selloff that wiped out all the progress for the year and then some. So what happened?
Fear got a little out of control yesterday as the market watched Bond Yields rising rapidly and topping 2.8% by the close. The market has also suddenly become hyper-aware of inflation and what that might mean for interest rates going forward. As traders, we always try to compartmentalize the cause of such events to and make some sense of it all. But the truth is when markets are euphoric or panic-stricken, it rarely makes sense. Unfortunately this emotional roller coaster and last much longer than one would expect. The only way to protect yourself and your capital is to stand aside and let it pass.
On the Calendar
The Tuesday Economic Calendar kicks off with International Trade at 8:30 AM. Sadly the trade deficit is expected to widen sharply to $51.9 billion. At 10:00 AM the JOLTS report is looking for a slight gain to 5.900 million today according to consensus estimates. The is a Fed Speaker at 8:50 AM and some bound auctions to complete today’s calendar.
Today is a pretty big day on the Earnings Calendar with about 150 companies scheduled to fess up. Today, we will hear from GM, DNKN, DIS, GILD and CMG just to name a few.
Action Plan
Futures have been moving very quickly and all over the map during the overnight session. Around 11 PM last night Dow Futures were down nearly 900 points. By 4:00 AM they were up more than 150 points but as I write this at 7:12 AM they are nearly 400. All the blood in the water has attracted the really big sharks. Whipped into a feeding frenzy, they will bite at anything, and we can expect this to last for a while. Little fish like retail traders are just chum in the water and stand very little chance of escaping if we’re in the water. Day’s, maybe even weeks of very challenging price action lie ahead. Get out and stay out of the water if you can.
Trade Wisely,
Doug
[button_2 color=”green” align=”center” href=”https://youtu.be/kzmiM0Myx1g”]Morning Market Prep Video[/button_2]
When Will The Selling Stop?
 At 6:30 AM EST this morning the SPY was sitting at $258.79, the big question today will be “When will the selling stop”? The simple answer is when the buyers get in the buying mood. If we open today near the $258.70 area, we will be at or near the. Dotted Deuce. Over my years of trading, I have used the Dotted Deuce and 200-SMA as profit zones, support and resistance. There is a very good chance we will see tradeable action around the Dotted Deuce and the 200-SMA. Remember to be patient and wait for the buy signals and chart setups.
About a week ago in the trading room, we spent some time talking about how the SPY was getting too far from the 50-SMA and that was not normal, something had to give. Now let’s consider the weekly chart and Fib lines. Note that last time the SPY was near the 200-SMA (Mid Feb. 2016). Set a Fib line on the lows and draw to the most recent high. The SPY is currently flirting around the 23.6 retracements. The point I am making is price has pulled much too far away from a major moving average like the 200-SMA for a long-term weekly chart.
►Learn the Power Of Simple Trading Techniques
On November 15, Rick shared ARNA as a trade for members to consider and how to use the trading tools listed below. Currently, the profits could have been about 55% or $1400.00 with 100 shares. Using our Simple, Proven Swing Trade Tools and techniques to achieve swing trade profits.
Candlesticks • Price Action • T-Line • T-Line Bands • Support • Resistance • Trend • Trendlines • Chart Patterns • Buy Box • Volatility Stops • Profit Zones • Entry Zones • Protective Stops • RBB Rounded Bottom Breakout Strategy • Pop Out of The Box Strategy • Pinball Strategy • Trade Planning… Learn More
►The VXX short-term futures
Have exploded hitting $60.00 plus pre-market this morning, note that is over the weekly 50-SMA.
Rick’s Swing Trade ideas
Member Login – Full Trade List
30-Day Trial • Monthly • Quarterly • Semi-Annual • Annual
►To learn more about our trading tools join us in the trading room or consider Private Coaching.
Investing and Trading involve significant financial risk and is not suitable for everyone. No communication from Hit and Run Candlesticks Inc. is financial or trading advice. All information is intended for Educational Purposes Only. Terms of Service.
Rick Saddler is not a licensed financial adviser nor does he offer trade recommendations or advice to anyone except for the trading desk of Hit and Run Candlesticks Inc.
*************************************************************************************
Clearly Below the T-Line
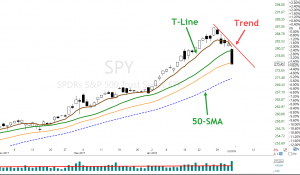 The SPY is clearly below the T-Line. Friday the SPY ran through the 20-SMA then landed on the 34-EMA Friday with a gap down on monster volume. This combination can only spell trouble! We always talk about Fridays should be a day to take profits and count your money. With the Bears still grazing this morning, The challenge of the 50-SMA seems likely this week. Because of the speed of the decline from Friday to this morning, I do not believe chasing is a wise idea. We will commonly look for trades after the market opens today and when the panic has calmed down. Throughout the day we will point out shorts and longs in our member’s blog area.
►Recent Trades VXX 375%
►Learn the Power Of Simple Trading Techniques
On December 13, Rick shared BOOT as a trade for members to consider and how to use the trading tools listed below. Currently, the profits could have been about 24.7% or $380.00 with 100 shares. Using our Simple, Proven Swing Trade Tools and techniques to achieve swing trade profits.
Candlesticks • Price Action • T-Line • T-Line Bands • Support • Resistance • Trend • Trendlines • Chart Patterns • Buy Box • Volatility Stops • Profit Zones • Entry Zones • Protective Stops • RBB Rounded Bottom Breakout Strategy • Pop Out of The Box Strategy • Pinball Strategy • Trade Planning… Learn More To learn more about our trading tools join us in the trading room or consider Private Coaching.
The VXX short-term futures –
I closed my VXX trade for 375% Friday, a good day to take profits, the VXX is on its way to tag our $36.75 line.
Rick’s Swing Trade ideas
Members watch for alerts and the MEMBERS BLOG – Login required
30-Day Trial • Monthly • Quarterly • Semi-Annual • Annual
Investing and Trading involve significant financial risk and is not suitable for everyone. No communication from Hit and Run Candlesticks Inc. is financial or trading advice. All information is intended for Educational Purposes Only. Terms of Service.
Rick Saddler is not a licensed financial adviser nor does he offer trade recommendations or advice to anyone except for the trading desk of Hit and Run Candlesticks Inc.
*************************************************************************************
Extreme Moves
 We all know that that the bulls were over exuberant and pretty much everyone and their dog expected a pullback. However, Friday’s extreme moves appeared to be excessive, right? Honestly, not so much. If you put it into the context of a 16500 point rally in the first 25-days fo January, you realize it’s only a reversion to the mean. Nevertheless, the violent nature of the move is shocking an I doubt anyone expected a 700 point move in one day! Volatility is very likely to continue making swing trading very challenging. Don’t make a mistake and assume that the market is suddenly oversold and predict the will rally. It can simply consolidate before resuming a downtrend!
On the Calendar
The is only one report of consequence on the Economic Calendar today. At 10:00 AM Eastern is the ISM Non-MFG Index which has cooled recently but remains mostly in the mid-50’s indicating growth. Forecasters are calling for an increase to 56.2 today. After that with have some bond announcements and auctions to round out the day.
On the Earnings Calendar, we have 70 companies reporting. Stay on your toes this week there are a lot of reports on the calendar. Prepare, plan and always check reporting dates of companies you own and those you are thinking of buying.
Action Plan
Without question, Friday produced shocking bearishness breaking supports as traders ran for the exits ahead of the weekend. Swing traders are mostly positive people, and the vast majority only want trade long. As a result, when they see a huge move lower like we did Friday they naturally want to believe the selloff is over. They try to predict when the bounce will occur only to find out that the sellers have more to say. Much like this morning with the Dow Futures suggesting more than a 200 point gap down! Even when the selling does stop, keep in mind that it could just consolidate before moving lower. Consider the fact that Dow 25,000 needs a test as support.
Remember every day does not have to be traded to be successful. Wait for good quality signals and remember the market is now very emotional. Big morning gaps and intra-day reversals could be the new normal in the short-term.
Trade Wisely,
Doug
[button_2 color=”green” align=”center” href=”https://youtu.be/Wu-MurdQHE0″]Morning Market Prep Video[/button_2]

Good morning team.
With XLE showing follow-through down I have purchased the FEB 78.5 Calls creating a credit spread. Then I closed the March 73 calls. Overall we still have an outstanding profit on the position.
Remember all trade ideas are for your evaluation and consideration.

 Can we go back to 2017? So far 2018 has tossed at us The Good, The Bad and The Ugly in the time span of just over one month. The Good, record highs and tremendous bullishness for the first 25 days of the year. The Bad, last Friday’s nasty selloff of nearly 700 Dow points. The Ugly, yesterdays record-breaking one-day selloff that wiped out all the progress for the year and then some. So what happened?