Trade War Fears
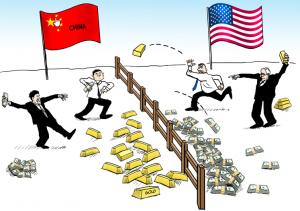 Fears of a US / China trade war took a major toll on the Dow yesterday as Boeing began to heavily sell-off. Although the weight of Dow pulled down on the other indexes, the QQQ, SPY, and IWM help up pretty well overall. Now the question is will there be follow-through selling or will the Bulls dig in and fight. Fear is a powerful emotion that is often irrational and pure speculation. Thus, price moves tend to be extreme as fear and quickly lead to full-on panic.
However, yesterday’s selling seemed measured and controlled with 3 of the four indexes holding onto a fragile but current up-trend. Keep in mind that big moves inspired by fear can also quickly reverse if that fear suddenly passes. Have a plan, stay focused on price and be prepared for anything but don’t let fear control your trading.
On the Calendar
Thursday is a big day on the Economic Calendar with several potential market-moving reports with four of them dropping at 8:30 AM. The weekly Jobless Claims is expected to come in at 229,000, continuing to show strong labor demand. A robust consensus of 23.0 with rising backlogs and the risk of hitting capacity constraints, from the Philly Fed Business Survey. The Empire Ste Mfg. Survey should come in cooler at 15.0 according to consensus. Then the Import/Export Prices are seen rising a moderate 0.3% on imports as well as 0.3% increases in export prices. At 10:00 AM we hear from the Housing Market Index which forecasters see steady strength with an unchanged reading or 72. To finish off the major reports today, we have the Treasury International Capital at 4:00 PM.
Today marks our last really big earnings day this season with nearly 190 companies expected to report. While there are earnings spread out for the remainder of the month, they should be overall less impactful as the number of reports diminishes.
Action Plan
Things were looking pretty good yesterday until fear of a trade war with China sent a share of BA sharply lower. After losing the 25,000 level, the Dow experienced some pretty heavy selling testing the lower boundary of the price wedge pattern. Although the SPY, QQQ, and IWM experienced some selling pressure, they all managed to close within their current uptrend and stayed above their respective 50-day averages.
I said yesterday that my gut tells me that the market wants to go higher. Yesterday’s price action while bearish didn’t dissuade that feeling. With 3 out of 4 indexes holding onto an uptrend, the technicals slightly favor the bulls as long as support levels hold. However, it wouldn’t take much more selling pressure to shift the battle to the bears so stay focused on price action. The current pullback has the potential to set-up some great entries if the bulls can tow the line. Mark up your watchlist and be prepared.
Trade Wisely,
Doug
[button_2 color=”green” align=”center” href=”https://youtu.be/k3wS2vOCzL8″]Morning Market Prep Video[/button_2]
Who invited the Bears?
 Okay, we had a nice little bull party going on; who invited the bears? It seems everywhere you look we see Bearish Engulfing candles and nasty failure patterns in the charts. Is it really that bad? First, let’s remember that Bearish Engulfing candles must follow-through in the next period to confirm. Without that confirmation, it’s nothing more than a day of profit-taking. Secondly, let’s step back from the hard right edge and notice that only the DIA has failed to break out into an uptrend. I pointed out yesterday that the index has moved up so many days in a row that rest or pullback was possible.
Please understand I’m not saying that to try and pat myself on the back for a correct call. What I’m trying to demonstrate is that if you remove emotion and study the price action, the answers are usually there. No prediction just simple observation. So, who invited the bears? The king of all indicators, Price Action.
On the Calendar
There are some big reports on the hump day Economic Calendar. At 8:30 AM we have two potential market-moving reports with PPI and Retail Sales. Consensus suggests the headline will come in up 0.2%. Remove food and energy, and it is expected to rise 0.2% while trade services move up 0.3%. According to forecasters, Retail Sales should snap back after declining in January with a 0.4% February expected increase. Remove autos and gasoline, and they see a 0.4% increase. Business Inventories at 10:00 AM should see a sizable build of 0.5% in January giving a boost the inventory component of GDP. Last but not least is the Petroleum Status Report which is on forecast but obviously critical the prices of oils stocks.
On the Earnings Calendar, I see 122 companies stepping up to report quarterly results. Stay on your toes as this earnings season finally begins to lighten up after this week.
Action Plan
The bears stepped in yesterday producing a slew of reversal patterns on all four major indexes on Tuesday. At the close Bearish Engulfing candles were left behind on the QQQ, IWM, SPY. The DIA was also under pressure one again failing at the 50-day average but managed to hold just above the physiological 25,000 level on the Dow index. It was pretty grim as I looked through my watchlists last night seeing lots of potential topping patterns and blue ice failure patterns all over the place.
One would naturally expect the bears to follow through today with another push lower today, but the premarket futures are indicating a willingness of the bull to fight back. As I write this, the Dow Futures are pointing to a gap up of about 80 points at the open. However, with all the early earnings news and important economic reports coming before the open anything is still possible. Everywhere I look in the charts I see clues of bearishness, but for some reason, my gut is telling me the market wants to go up. That’s not a prediction; it’s merely a feeling that of course will have to be confirmed by price action. Price is king and always will be.
Trade Wisely,
Doug
[button_2 color=”green” align=”center” href=”https://youtu.be/99bX2M2tiS8″]Morning Market Prep Video[/button_2]
CREE Pop Out Of the Box Pattern
CREE broke out and is currently set up with a Pop Out OF the Box Pattern. CREE dropped below the 5-SMA earlier this year and recently put together a bullish run to close back above the 50-SMA, pulled back for a test, then exploded. The current consolidation (Box) could be a buying opportunity. The weekly chart printed a killer Bullish Morning Star Signal a few bars ago.
We will discuss the trade in detail with a trading plan in our Members Morning Prep starting at 9:10 EST this morning. members morning briefing
►Recently closed
WTW 21.9% • VIPS 118% • VXX 375% • TWTR 180% • QQQ 179% • QQQ 28% • TWTR 54% • OCN 39% • FEYE 28% • TWTR 50%
[button_2 color=”red” align=”center” href=”https://ob124-cea4cb.pages.infusionsoft.net/” new_window=”Y”]Fibonacci Workshop Tomorrow 3/15/18[/button_2]
►SPY Up-Date
Yesterday the sellers in the SPY put together a Bearish Evening Star after peaking into the resistance box. The question today will be whether or not there is bearish follow through to the 5-SMA or a bullish turnaround. Note the current trend is still bullish starting from the February lows. The DIA’s did not play very well yesterday closing below the 50-SMA and the downtrend line.
Candlesticks • Price Action • T-Line • T-Line Bands • Support • Resistance • Trend • Trendlines • Chart Patterns • Buy Box • Volatility Stops • Profit Zones • Entry Zones • Protective Stops • RBB Rounded Bottom Breakout Strategy • Pop Out of The Box Strategy • Pinball Strategy • Trade Planning
►The VXX short-term futures
VXX is currently trying to build a support base around the $38.25 area
►Rick’s Swing Trade Ideas Reserved for Subscribing Members
30-Day Trial • Monthly • Quarterly • Semi-Annual • Annual
To learn more about our trading tools join us in the trading room or consider Private Coaching. Rick will help coach you to trading success.
Investing and Trading involve significant financial risk and is not suitable for everyone. No communication from Hit and Run Candlesticks Inc. is financial or trading advice. All information is intended for Educational Purposes Only. Terms of Service.
Rick Saddler is not a licensed financial adviser nor does he offer trade recommendations or advice to anyone except for the trading desk of Hit and Run Candlesticks Inc.
*************************************************************************************
Good Morning team.
The market is looking a little stretched so decide if you want to even consider an new positions carefully. Having said that I really like the setup on M. Consider buying the May 27 Calls to begin a directional trade. We may leg into a debit or calendar spread later. Initial stop loss at $28.10.
Doug
Remember all trade ideas are for your evaluation and consideration.
Price is King
 After two months of messy price action, the storm clouds are giving way to blue skies, but it may take a little longer for smooth sailing to return. The DIA continues to lag significantly behind the other indexes as it continues to struggle with its 50-day average as resistance. The QQQ is leading the way, and the SPY and IWM are not far behind dragging the DIA along like a boat anchor. Clearly, the other indexes can continue to move higher without the DIA, but the work will be harder until it can carry its weight rather than being dragged. Overall the bulls are in control, and many stocks have resumed their trends but don’t be surprised if the daily index price action starts to grind or even slips into consolidation. There can be great trading in this environment, but we may have to exercise some patience and plan a little extra holding time for options trades.
On the Calendar
Only one big report today’s Economic Calendar but the Consumer Price Index is one that can move the market. The report comes out at 8:30 AM Eastern and will be watched closely for pricing pressures which, of course, would signal inflation. Consensus for the headline CPI is for a monthly gain of 0.2% and a yearly rate of 2.2% up just one-tenth. Remove food and energy, and consensus expects a slight rise to 1.9% A couple of smaller reports from Small Business Optimism, Redbook, and a couple of bond events round out the day.
On the Earnings Calendar just short of 110 companies are expected to report earnings today.
Action Plan
An interesting mix of price action in the indexes yesterday as the QQQ sailed to new records while the DIA sold off below the 50-day average once again. The SPY saw only modest profit taking while the IWM squeezed out its 7th day up in the current rally. All in all a good showing by the bulls considering the size of last Friday’s rally. The VIX managed a small rally but by the close remained under resistance and the 50-day average as market fears seem to be calming down.
As I write this Dow Futures are pointing to about a 70 point gap up which would recover about half of yesterdays losses, but a lot could still change, and earnings as economic news come out. The T2122 4 week new high / low ratio is suggesting the current rally is getting a bit long in the tooth, and a pullback or consolidation may be just around the corner. There are a lot of very nice looking charts but be careful on to chase. Remember we want to buy stocks at or near price support. The bulls are in control so any consolidation or pullback that holds support could set up great trade entries.
Trade Wisely,
Doug
[button_2 color=”green” align=”center” href=”https://youtu.be/OwR7YUK_Uvk”]Morning Market Prep Video[/button_2]
T-Line PBO Bullish Engulf
EVH ended yesterday with a Bullish Engulf on the T-Line and is in our Rounded Bottom Breakout Pattern. After the bullish engulf price had bullish follow through. After running into sellers about $16.50 price pulled back creating a PBO set up. If we decide to trade EVH, we will use our RBB rules. With the help of Fibonacci Lines, I will be setting up my plan for about a 20% trade.
We will discuss the trade details with our trade plan in our Members Morning Prep starting at 9:10 EST this morning. members morning briefing
►Recently Closed Trades
WTW 21.9% • VIPS 118% • VXX 375% • TWTR 180% • QQQ 179% • QQQ 28% • TWTR 54% • OCN 39% • FEYE 28% • TWTR 50%
[button_1 text=”Education%20is%20the%20Key%20To%20Success” text_size=”32″ text_color=”#000000″ text_bold=”Y” text_letter_spacing=”0″ subtext_panel=”Y” subtext=”Click%20Me” subtext_size=”18″ subtext_color=”#ffffff” subtext_bold=”Y” subtext_letter_spacing=”0″ text_shadow_panel=”N” styling_width=”40″ styling_height=”30″ styling_border_color=”#000000″ styling_border_size=”1″ styling_border_radius=”6″ styling_border_opacity=”100″ styling_gradient_start_color=”#ff0004″ styling_gradient_end_color=”#ff0004″ drop_shadow_panel=”N” inset_shadow_panel=”N” align=”center” href=”https://ob124-cea4cb.pages.infusionsoft.net/” new_window=”Y”/]
►SPY Up-Date
Today will be the 6th day of a Bullish T-Line Run as the SPY shows it’s strength after a pattern breakout. Yesterday’s close is what we call a Doji continuation pattern which should lead us to $281.55. When looking at your SPY chart take a look at the weekly, you can see how price has formed a bullish engulf and how the 34-EMA has started to tend again. A close below $277.90 would likely lead to a test of the 50-SMA.
Candlesticks • Price Action • T-Line • T-Line Bands • Support • Resistance • Trend • Trendlines • Chart Patterns • Buy Box • Volatility Stops • Profit Zones • Entry Zones • Protective Stops • RBB Rounded Bottom Breakout Strategy • Pop Out of The Box Strategy • Pinball Strategy • Trade Planning
►The VXX short-term futures
VXX took a nose dive and looks to be headed to the 50-SMA for now (no change form yesterdays comment)
►Rick’s Swing Trade Ideas Reserved for Subscribing Members
30-Day Trial • Monthly • Quarterly • Semi-Annual • Annual
To learn more about our trading tools join us in the trading room or consider Private Coaching.
Investing and Trading involve significant financial risk and is not suitable for everyone. No communication from Hit and Run Candlesticks Inc. is financial or trading advice. All information is intended for Educational Purposes Only. Terms of Service.
Rick Saddler is not a licensed financial adviser nor does he offer trade recommendations or advice to anyone except for the trading desk of Hit and Run Candlesticks Inc.
*************************************************************************************
Predicting
 This weekend I received an email suggesting that I’m completely wrong and that all trading and all traders are predicting. I wholeheartedly disagree. Gamblers are predictors that continually lose money because they focus on the big win rather than the business of trading. To be successful as a trader over the long haul, you have to think like the CEO of a business. A CEO makes business decisions only after careful risk analysis and planning that puts the odds of winning in their favor. In other words, a good trader thinks like the House working every day to maintain a statistical advantage where the potential rewards are always greater than the risk. Be the House! Make business decisions and leave the predicting to the amateurs.
On the Calendar
W have a busy week on the Economic Calendar, but we kick it off with a light Monday. We have five bond events throughout the day follow only by the Treasury Budget at 2:00 PM. The consensus is calling for a monthly deficit of $216.0 billion because of tax reform.
On the Earnings Calendar, this should be the last big week of the quarter with more than 500 companies reports. Today we will hear from about 120. Remember checking earnings reports against current holdings each day as part of your daily preparation is an important habit to develop.
Action Plan
Friday was a rip-roaring day as the bulls gathered in a show of force and firmly re-establishing their control of the market. The QQQ set a new record high to begin the day and just kept right on pushing higher through the close. The SPY not only drove through the downtrend line but also managed to close above the February resistance. The IWM tested the resistance of record highs, and even the DIA which has been lagging behind found the energy to break through its 50-day average.
As I write this, the Dow Futures are pointing to a 100 point gap up to punctuate Friday’s bull run. Even though the bulls appear are large and in the pre-market be careful not to get caught up in the exuberance by chasing. To marks, the 7th day of a straight up QQQ’s rally and with today’s gap up the Dow will have improved by nearly 900 points in 4 days! A little rest or even some profit-taking is not out the question. In-fact a consolidation or slight pullback to test supports would be a very normal and healthy price action. Your watchlist of trending stocks should now contain a target rich environment for quality setups assuming the bull maintain control.
Trade Wisely,
Doug
[button_2 color=”green” align=”center” href=”https://youtu.be/gImrIbHsnEU”]Morning Market Prep Video[/button_2]
Bullish Trend Since Later December
CVEO has a bullish trend since late December while constructing a good bottom. The trending construction on the weekly chart has put together clues like a Bullish “W” pattern, Bullish Cradle pattern, and a Bullish Inverted Head and shoulder. Recently the Bullish Engulf Double Bottom found and created support.
We do not and have never recommended a stock to trade. We post trade ideas that we have on our watchlist. We may or may not trade them. Not all trade ideas are traded and not all trade ideas work in our favor. Proper trading education is a must without it the probability of success is zip.
We will discuss the trade details with our trade plan in our Members Morning Prep starting at 9:10 EST this morning. members morning briefing
►Recently closed
WTW 21.9% • VIPS 118% • VXX 375% • TWTR 180% • QQQ 179% • QQQ 28% • TWTR 54% • OCN 39% • FEYE 28% • TWTR 50%
[button_1 text=”Get%20In%20On%20IT!” text_size=”32″ text_color=”#000000″ text_bold=”Y” text_letter_spacing=”0″ subtext_panel=”Y” subtext=”Click%20Here%20%E2%80%A2%20Learn%20More” subtext_size=”15″ subtext_color=”#d70909″ subtext_bold=”Y” subtext_letter_spacing=”0″ text_shadow_panel=”N” styling_width=”40″ styling_height=”30″ styling_border_color=”#000000″ styling_border_size=”1″ styling_border_radius=”6″ styling_border_opacity=”100″ styling_gradient_start_color=”#3587ff” styling_gradient_end_color=”#3587ff” drop_shadow_panel=”N” inset_shadow_panel=”N” align=”center” href=”https://ob124-cea4cb.pages.infusionsoft.net/” new_window=”Y”/]
►SPY Up-Date
The SPY finished the week in a great Bullish position now that price as broke out to the bullish side of the triangle chart pattern. The line the bulls need to defend is $273.00 if this can happen there is a very good probability of challenging the January high. The weekly chart is supporting a Bullish Engulf, remembers followthrough the key and followthrough is not required right away.
Candlesticks • Price Action • T-Line • T-Line Bands • Support • Resistance • Trend • Trendlines • Chart Patterns • Buy Box • Volatility Stops • Profit Zones • Entry Zones • Protective Stops • RBB Rounded Bottom Breakout Strategy • Pop Out of The Box Strategy • Pinball Strategy • Trade Planning
►The VXX short-term futures
VXX took a nose dive and looks to be headed to the 50-SMA for now
►Rick’s Swing Trade Ideas Reserved for Subscribing Members
30-Day Trial • Monthly • Quarterly • Semi-Annual • Annual
To learn more about our trading tools join us in the trading room or consider Private Coaching. Rick will help coach you to trading success.
Investing and Trading involve significant financial risk and is not suitable for everyone. No communication from Hit and Run Candlesticks Inc. is financial or trading advice. All information is intended for Educational Purposes Only. Terms of Service.
Rick Saddler is not a licensed financial adviser nor does he offer trade recommendations or advice to anyone except for the trading desk of Hit and Run Candlesticks Inc.
*************************************************************************************

 Fears of a US / China trade war took a major toll on the Dow yesterday as Boeing began to heavily sell-off. Although the weight of Dow pulled down on the other indexes, the QQQ, SPY, and IWM help up pretty well overall. Now the question is will there be follow-through selling or will the Bulls dig in and fight. Fear is a powerful emotion that is often irrational and pure speculation. Thus, price moves tend to be extreme as fear and quickly lead to full-on panic.