RDN Breaking Resistance with a Bullish Engulf

RDN Breaking Resistance with a Bullish Engulf

RDN is breaking resistance with a Bullish Engulf into an (RBB) Rounded Bottom Breakout pattern. RDN’s Bullish Engulf started below the T-Line and closed the 34-EMA and 50-SMA into an RBB pattern. The RBB pattern is one of my favorite chart patterns and has contributed a huge amount of profits to the account. With an excellent risk-reward, I am looking forward to trading RDN. We look forward to seeing you in the trading room today. Ever wonder how we do in our trading account? Through May we are up 157%, we are on track to be up over 175% for June in our “Road To Wealth Account” Click Here To See Trading education pays off!

FACT: Education is the key to trading success.

[button_2 color=”green” align=”center” href=”https://ob124-cea4cb.pages.infusionsoft.net/” new_window=”Y”]Tonight’s Fib Workshop IS Filling Up • Read More About It[/button_2]

SPY • T-Line Run In Play

Another buyer controlled day yesterday with price action leading the T-Line. The buyers brought price within .28 cents of our SPY target; it is likely to be tagged today. The next price target will be $280.40 we have raised the support lint to the $274.10 area. Please be reminded not every day is about making money, some days are about preserving what you have made.

VXX – (No change) The Red, the White and Blue indicator is signaling there is no fear in the VXX chart. Price is in a T-Line run down.

Rick’s Trade-Ideas Reserved for Members

Trading ResultsMonthlyQuarterlySemi-AnnualAnnual

Focus Trading Education

Candlesticks • Price Action • T-Line • T-Line Bands • Support • Resistance • Trend • Trendlines • Chart Patterns • Buy Box • Volatility Stops • Profit Zones • Entry Zones • Protective Stops • RBB Rounded Bottom Breakout Strategy • Pop Out of The Box Strategy • Pinball Strategy • Trade Planning, Fibonacci, Stoch/RSI

To learn more about our trading tools join us in the trading room or consider Private Coaching.

Testimonial

This is not your usual service that sends out a ton of stock recommendations, and then cherry picks the winners to show you how great they are. Hit and Run Candlesticks and Right Way Options are truly educational services. They taught me how to trade not what to trade. The entire team: Rick, Doug, Steve, and Ed are there to help and answer your questions. They are awesome. They cut years off my learning curve. And it’s a team effort. Everyone in the room (all the members) are there to help with invaluable insights and advice. The only service you will ever need. Thanks to all the team for how you have helped me and for all you do. –Jonathan Bolnick

Rare to have a service teach you how they find their choices but, HRC/RWO teach you how to fish instead of fishing for you. And, your ideas are not panned but shared, implemented, or improved. Sharing is caring. –Thomas Bradly


Investing and Trading involve significant financial risk and is not suitable for everyone. No communication from Hit and Run Candlesticks Inc. or Rick Saddler is to be considered financial or trading advice. All information is intended for Educational Purposes Only. Terms of Service.

Rick Saddler is not a licensed financial adviser nor does he offer trade recommendations or advice to anyone.

*************************************************************************************


RDN Setup and Trade Plan

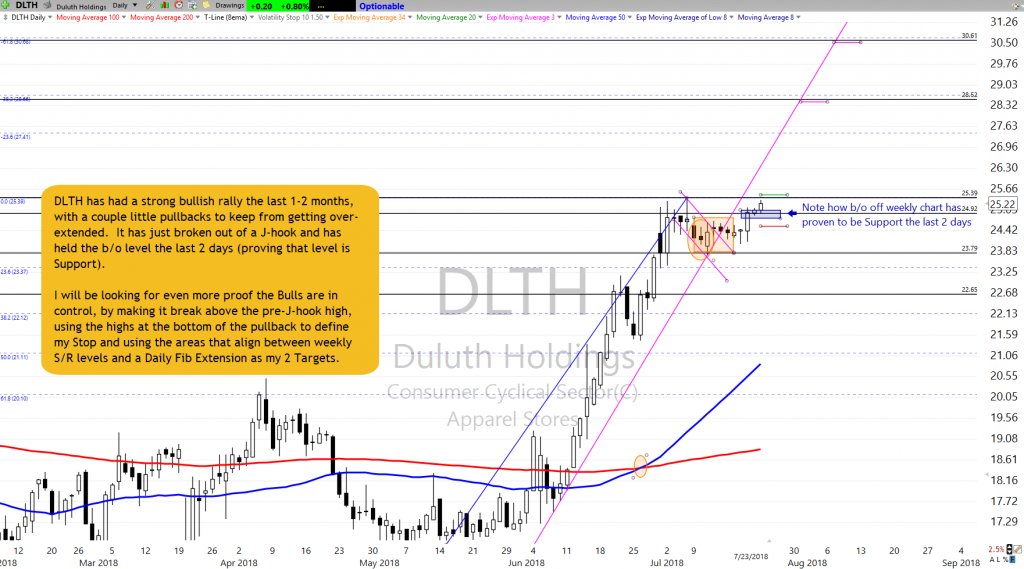
Today’s Featured Trade Idea is RDN.  Wednesday it broke out of a resistance level and into an RBB pattern on a Bullish Engulfing signal.  It has room to run overhead up to the next resistance and the resistance level broken yesterday as well as another level close below to act as support.  On a retest of the $16.50 area and a bounce I’d look for an Entry near Wednesday’s Closing price, using the well-defined resistance levels above as potential target prices.  The chart and trade plan are shown below.  As a bonus, if you click the green button below, you’ll be able to watch a video of the chart markup and trade planning process.

For a more detailed analysis of the ticker, refer to Rick’s Public Stock Trade Idea for today…or, of course, members can listen to his detailed analysis in the trading room at 9:10am Eastern.

However, for now, here is my analysis and a potential trade plan made using our Trader Vision 20/20 software.


The RDN Trade Setup – As of 6-6-18

RDN as of 6-6-18


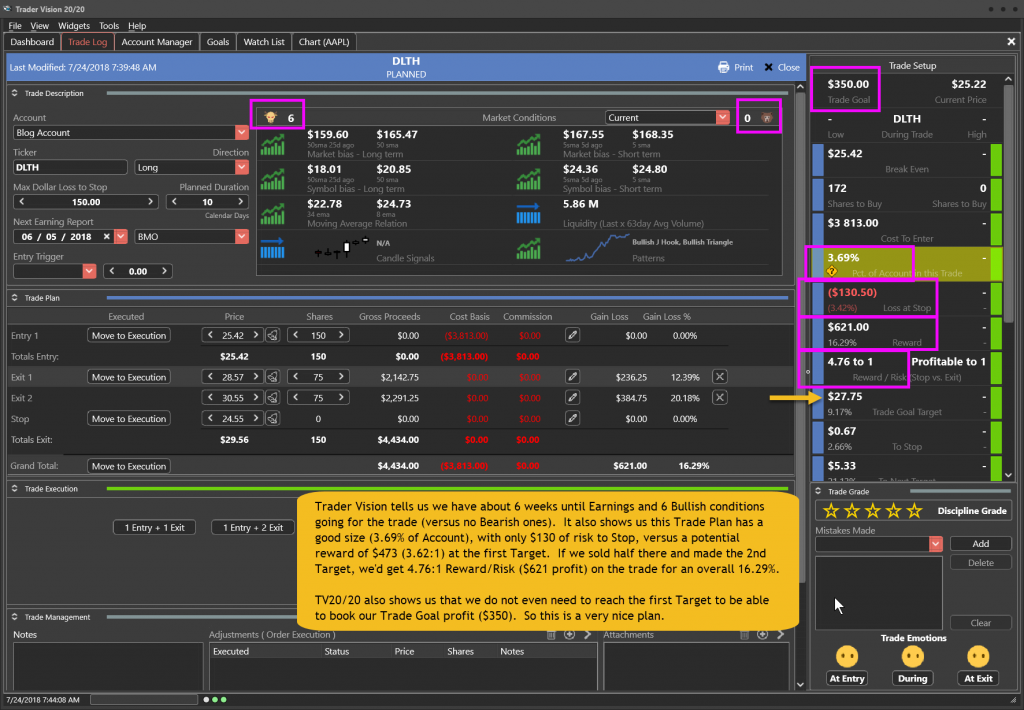
The RDN Trade Plan


Note how Trader Vision 20/20 does so much of the work for you.  As the arrows above show, with Trader Vision, not only do we know exactly how much money is at risk (if stopped out), but also the reward dollars and Reward/Risk Ratio at each Target price as we plan a trade.  We can also see the price the stock must reach in order for us to meet our trade goal.  Having all this information ahead of time takes the pressure off during a trade.  We know the risk, the potential reward and the levels (Stop and Target) where we’re going to be exiting the trade.  No guesswork or emotional roller coaster involved!

To see a short video of this trade’s chart markup and trade planning, click the button below.


[button_2 color=”light-green” align=”center” href=”https://youtu.be/wn3z7WPiJ2Q” new_window=”Y”]Trade Plan Video[/button_2]


If you’re interested in putting the power to Trader Vision 20/20 to work for you, click below.

[button_2 color=”orange” align=”center” href=”https://hitandruncandlesticks.com/product/trader-vision-20-20-monthly-subscription2/” new_window=”Y”]TV20/20 Software[/button_2]


Last chance!  Act now to

Save your seat for Thursday’s session.

Trading With Fibonacci Retracements/Extensions

6/7/18 at 8pm Eastern

  • Why do Fib Ratios Work?
  • Why Should You Use Extensions instead of Projections?
  • Answers to Common Problems Using Fibs.
  • Where do you begin and end your drawing?
  • Do we use Bodies or Wicks?
  • Which Ratios should be your focus?
  • How to Identify the major support/resistance Levels with Fibs?
  • How to Find Entries with Fib Retracements?
  • How to Set Targets Using Fib Extensions?


[button_2 color=”red” align=”center” href=”https://ob124-cea4cb.pages.infusionsoft.net/” new_window=”Y”]Fibonacci Retracement An Extensions Workshop • Click To Learn More[/button_2]


Testimonial

This is not your usual service that sends out a ton of stock recommendations, and then cherry picks the winners to show you how great they are. Hit and Run Candlesticks and Right Way Options are truly educational services. They taught me how to trade not what to trade. The entire team: Rick, Doug, Steve, and Ed are there to help and answer your questions. They are awesome. They cut years off my learning curve. And it’s a team effort. Everyone in the room (all the members) are there to help with invaluable insights and advice. The only service you will ever need. Thanks to all the team for how you have helped me and for all you do. –Jonathan Bolnick


***************************************************************************************************

Investing and Trading involve significant financial risk and are not suitable for everyone. Ed Carter is not a licensed financial adviser nor does he offer trade recommendations or investment advice to anyone. No communication from Hit and Run Candlesticks Inc. is to be considered financial or trading advice. All information is intended for Educational Purposes Only. Terms of Service.

***************************************************************************************************
June 5, 2018 e-Learning Trading Psychology

Member e-Learning June 5, 2018

Psychological Boost

Member e-Learning from June 5, 2018.  In this session, Doug Campbell covered Trading Psychology,  the Psychology behind Price Action and treating trading like a business.


Candlesticks • Price Action • T-Line • T-Line Bands • Support • Resistance • Trend • Trendlines • Chart Patterns • Buy Box • Volatility Stops • Profit Zones • Entry Zones • Protective Stops • RBB Rounded Bottom Breakout Strategy • Pop Out of The Box Strategy • Pinball Strategy • Trade Planning, Fibonacci, Stoch/RSI


[video_player type=”embed” style=”1″ dimensions=”custom” width=”640″ height=”480″ align=”center” margin_top=”0″ margin_bottom=”20″ ipad_color=”black”]PGlmcmFtZSBzcmM9Imh0dHBzOi8vcGxheWVyLnZpbWVvLmNvbS92aWRlby8yNzM3NDUxNTQiIHdpZHRoPSI2NDAiIGhlaWdodD0iMzYwIiBmcmFtZWJvcmRlcj0iMCIgd2Via2l0YWxsb3dmdWxsc2NyZWVuPSIiIG1vemFsbG93ZnVsbHNjcmVlbj0iIiBhbGxvd2Z1bGxzY3JlZW49IiI+PC9pZnJhbWU+ICAKCgo=[/video_player]


Investing and Trading involves significant financial risk and is not suitable for everyone. No communication from Hit and Run Candlesticks or it’s associates should be considered as financial or trading advice. All information is intended for Educational Purposes Only. Terms of Service

Technical Analysis of Price Action

[img_text_aside style=”1″ image=”https://hitandruncandlesticks.com/wp-content/uploads/2018/06/Thumbnail.png” image_alignment=”left” headline=”” alignment=”center”]In this E-Learning session we covered the process of identifying support, resistance and trend.  How to mark up charts so the the trades come to you rather than you chasing the trade.

[/img_text_aside]

Another Victory for the Bulls

Another Victory for the Bulls

Victory for the BullsAfter closing at new records high in the QQQ’s and IWM yesterday futures currently suggest yet another bullish open this morning.  Even though the DIA and SPY close the day flat, I consider that a victory for the Bulls as they held on to Monday’s strong performance.  Although there are lots good charts, If your not already in this rally I would caution you not to chase.

The fear of missing out is a very strong emotion that every trader has to overcome.  If you miss an entry, it’s usually better the just let it pass then to chase into the trade.  I can tell from painful experience that chasing often has the trader entering at or near the point when the stock pulls back.  Instead of chasing, mark up the chart put it in a watchlist and wait for the next entry signal.  As long as a stock maintains, a trend there will be more opportunities to profit.

On the Calendar

There are three potential market-moving events on Wednesday’s Economic Calendar.  At 8:30 AM Eastern we get readings on both International Trade & Productivity and Costs.  Forecasters expect the international trade deficit for goods and services to hold steady in April at $49.0 Billion.  Productivity is expected to grow 0.7 percent with unit labor costs up 2.8 percent vs. the 2.7 reading last month.  At 10:30 AM we get the latest reading on Petroleum Supplies which have no forward forecast.  Other than that we have a reading of Mortgage Applications at 7:00 AM and Treasury STRIPS at 3:00 PM but are unlikely to move the market.

On the Earnings Calendar, we have 46 companies reporting quarterly results.  Among them are SIG which reports before the bell and FIVE reporting after the close.

Action Plan

Yesterday we saw both the DIA and SPY chop sideways ending the day about where they started.  After such a big move on Monday, I view this a win for the Bulls.  The QQQ’s closed the day at a new record high as did the IWM which is showing impressive strength and leading the overall market.  During the evening Asian and European were both bullish giving the US Futures an overnight boost.  As I write this Dow Futures are pointing to a gap open of nearly 100 points, but that could certainly change as earnings and economic data come out.

While I remain overall bullish, I’m watching price action closely for clues pullback or profit taking as this rally matures.  If the QQQ’s open positively as the futures currently suggests, it’s the 7th straight day of gains a reason to watch for signs of profit taking.  As the QQQ’s and IWM gap up to new record highs, be careful not to chase stocks late there run.  Go Bulls!

Trade Wisely,

Doug

[button_2 color=”green” align=”center” href=”https://youtu.be/j0v_ZvciNYk”]Morning Market Prep Video[/button_2]

HBI Painting a Bullish Reverse Scoop

HBI Painting a Reverse Scoop

HBI is painting a Bullish Reverse Scoop pattern inside an (RBB) Rounded Bottom Breakout pattern. With the (RBB) pattern we are looking for the price action and trend too and through the Dotted Duece moving average and then follow through to the 200-SMA. Of course, normal price action will occur. The Reverse Scoop patterns is a Bullish reversal pattern that occurs, not always but mostly at the bottom. Take a good look at the Reverse Scoop pattern, 99% of the time you will also see a Bullish Inverted Head and Shoulder pattern.

Remember to check out the TV2020 blog for the trade plan. FACT: Education is the key to trading success.

[button_1 text=”Educational%20Fibonacci%20Workshop%20″ text_size=”32″ text_color=”#000000″ text_bold=”Y” text_letter_spacing=”0″ subtext_panel=”Y” subtext=”Thursday%20June%207%20%E2%80%A2%20Click%20and%20Learn%20More” subtext_size=”14″ subtext_color=”#ffffff” subtext_bold=”Y” subtext_underline=”Y” subtext_letter_spacing=”0″ text_shadow_panel=”N” styling_width=”40″ styling_height=”30″ styling_border_color=”#000000″ styling_border_size=”1″ styling_border_radius=”6″ styling_border_opacity=”100″ styling_gradient_start_color=”#e41112″ styling_gradient_end_color=”#e41112″ drop_shadow_panel=”N” inset_shadow_panel=”N” align=”center” href=”https://ob124-cea4cb.pages.infusionsoft.net/” new_window=”Y”/]


SPY • T-Line Run In Play

Wow was yesterday a good day or what!, If you missed it check out the trading result on our website.

The SPY posted another higher close, as well as its friends, QQQ, IWM, and the DIA’s, are looking good with the futures this morning. In the SPY the higher highs and higher lows are working, and the T-Line Run is in play. The next number for the buyers to attack is about the $277.80 area, and support is about $273.05

VXX – (No change) The Red, the White and Blue indicator is signaling there is no fear in the VXX chart. Price is in a T-Line run down.

Rick’s Trade-Ideas Reserved for Members

Trading ResultsMonthlyQuarterlySemi-AnnualAnnual

Focus Trading Education

Candlesticks • Price Action • T-Line • T-Line Bands • Support • Resistance • Trend • Trendlines • Chart Patterns • Buy Box • Volatility Stops • Profit Zones • Entry Zones • Protective Stops • RBB Rounded Bottom Breakout Strategy • Pop Out of The Box Strategy • Pinball Strategy • Trade Planning, Fibonacci, Stoch/RSI

To learn more about our trading tools join us in the trading room or consider Private Coaching.

Testimonial

This is not your usual service that sends out a ton of stock recommendations, and then cherry picks the winners to show you how great they are. Hit and Run Candlesticks and Right Way Options are truly educational services. They taught me how to trade not what to trade. The entire team: Rick, Doug, Steve, and Ed are there to help and answer your questions. They are awesome. They cut years off my learning curve. And it’s a team effort. Everyone in the room (all the members) are there to help with invaluable insights and advice. The only service you will ever need. Thanks to all the team for how you have helped me and for all you do. –Jonathan Bolnick

Rare to have a service teach you how they find their choices but, HRC/RWO teach you how to fish instead of fishing for you. And, your ideas are not panned but shared, implemented, or improved. Sharing is caring. –Thomas Bradly


Investing and Trading involve significant financial risk and is not suitable for everyone. No communication from Hit and Run Candlesticks Inc. or Rick Saddler is to be considered financial or trading advice. All information is intended for Educational Purposes Only. Terms of Service.

Rick Saddler is not a licensed financial adviser nor does he offer trade recommendations or advice to anyone.

*************************************************************************************


HBI Setup and Trade Plan

Today’s Featured Trade Idea is HBI.  There is a lot to like about this stock which has been solidly Bullish lately.  Tuesday it broke out of and Inverted Head & Shoulders pattern, which was also an RBB pattern that held the 50sma and a J-hook type pattern.  It confirmed Monday’s Morning Star signal and has room to run up to the next Resistance level. Below are screenshots of the chart and Trader Vision trade plan.  As a bonus, if you click the green button below, you’ll be able to watch a video of the chart markup and trade planning process.

For a more detailed analysis of the ticker, refer to Rick’s Public Stock Trade Idea for today…or, of course, members can listen to his detailed analysis in the trading room at 9:10am Eastern.

However, for now, here is my analysis and a potential trade plan made using our Trader Vision 20/20 software.

The HBI Trade Setup – As of 6-5-18


The HBI Trade Plan


Note how Trader Vision 20/20 does so much of the work for you.  As the arrows above show, with Trader Vision, not only do we know how much money is at risk (if stopped out), but also the reward dollars at each Target price as we plan a trade.  We can also see the price the stock must reach in order for us to meet our trade goal.  Having all this information ahead of time takes the pressure off during a trade.  We know the risk, the potential reward and the levels (Stop and Target) where we’re going to be exiting the trade.  No guesswork or emotional roller coaster involved!

To see a short video of this trade’s chart markup and trade planning, click the button below.  Note that while this was a 8:45 video, a minute of this is intro/outro and the process is slowed down with me taking the time to explain to the camera.  The Trader Vision portion of this process was probably 1-3 minutes on a typical plan.


[button_2 color=”light-green” align=”center” href=”https://youtu.be/dzV8CvnEjlE” new_window=”Y”]Trade Plan Video[/button_2]


Last chance!  Act now to

Save your seat for Thursday’s session.

Trading With Fibonacci Retracements/Extensions

6/7/18 at 8pm Eastern

  • Why do Fib Ratios Work?
  • Why Should You Use Extensions instead of Projections?
  • Answers to Common Problems Using Fibs.
  • Where do you begin and end your drawing?
  • Do we use Bodies or Wicks?
  • Which Ratios should be your focus?
  • How to Identify the major support/resistance Levels with Fibs?
  • How to Find Entries with Fib Retracements?
  • How to Set Targets Using Fib Extensions?


[button_2 color=”red” align=”center” href=”https://ob124-cea4cb.pages.infusionsoft.net/” new_window=”Y”]Fibonacci Retracement An Extensions Workshop • Click To Learn More[/button_2]


Testimonial

This is not your usual service that sends out a ton of stock recommendations, and then cherry picks the winners to show you how great they are. Hit and Run Candlesticks and Right Way Options are truly educational services. They taught me how to trade not what to trade. The entire team: Rick, Doug, Steve, and Ed are there to help and answer your questions. They are awesome. They cut years off my learning curve. And it’s a team effort. Everyone in the room (all the members) are there to help with invaluable insights and advice. The only service you will ever need. Thanks to all the team for how you have helped me and for all you do. –Jonathan Bolnick


***************************************************************************************************
Investing and Trading involve significant financial risk and are not suitable for everyone. No communication from Hit and Run Candlesticks Inc. is to be considered financial or trading advice. All information is intended for Educational Purposes Only. Terms of Service.

Ed Carter is not a licensed financial adviser nor does he offer trade recommendations or advice to anyone.

***************************************************************************************************