Five Bars OF Bullish Consolidation On Support
Five Bars OF Bullish Consolidation On Support
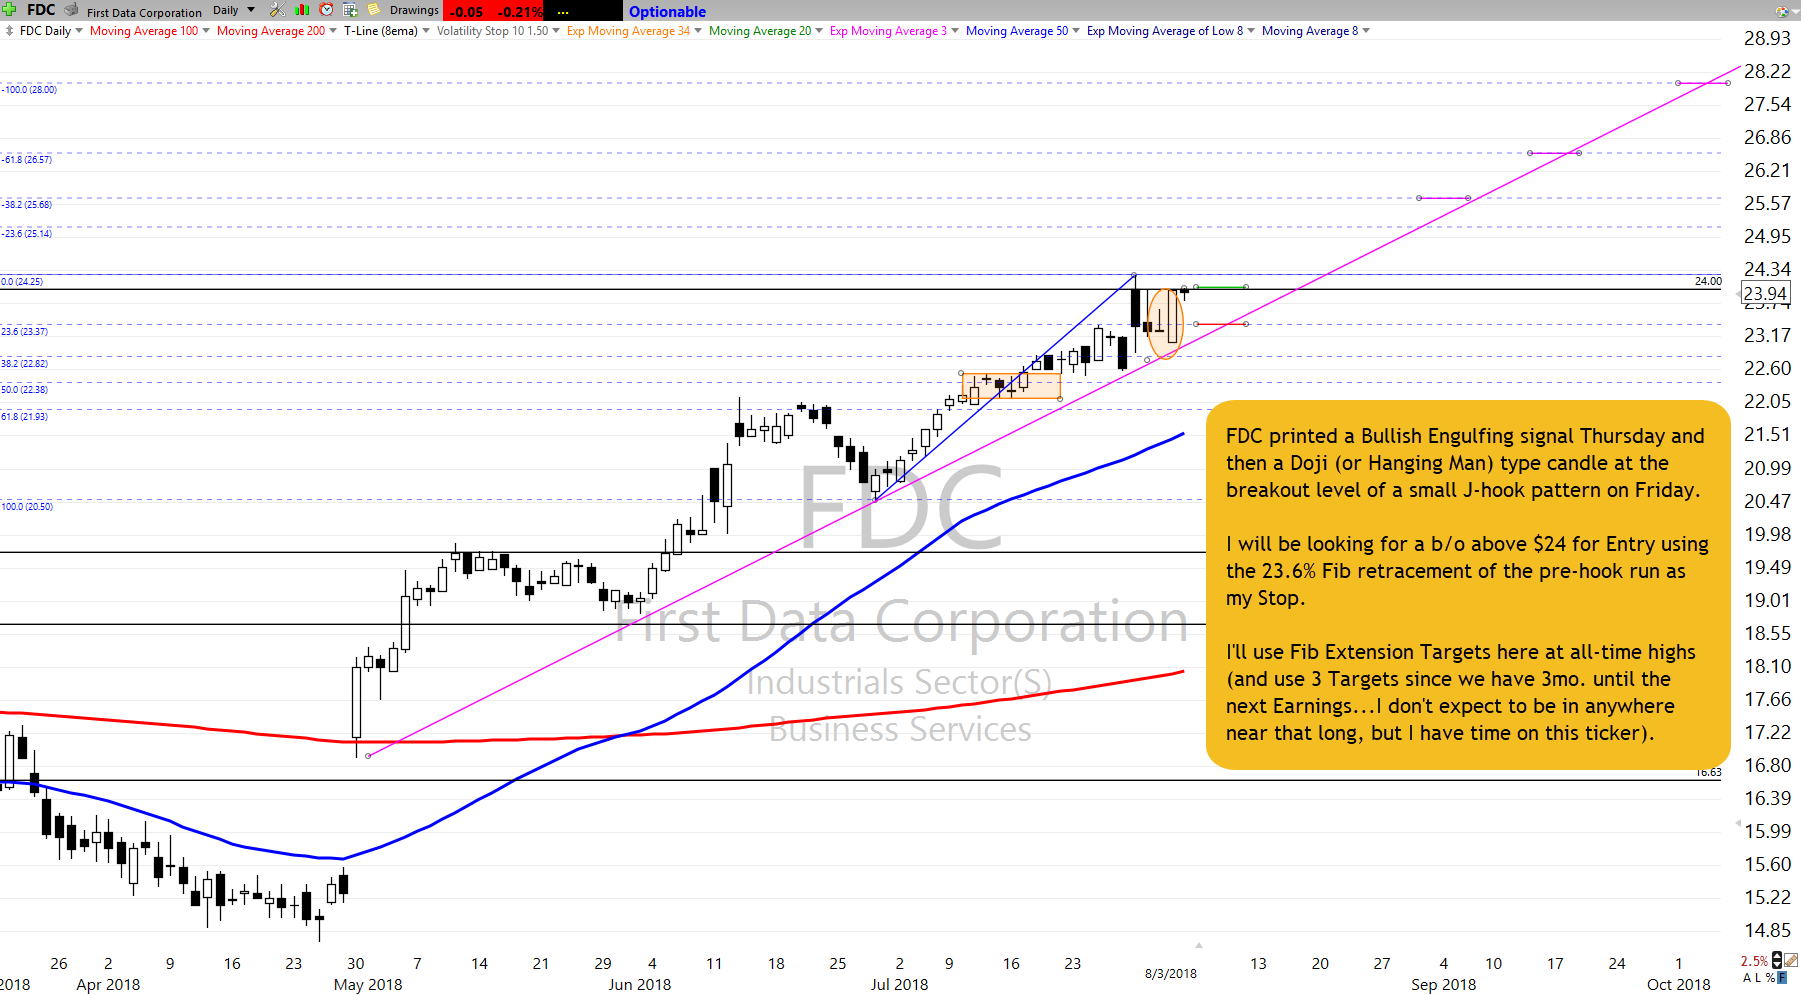
 Five bars of bullish consolidation on support after a trend reversal on the April gap. The trend has continued to post higher lows and higher highs while remaining above the bullish trend line. The July candle gapped and slid back holding support; the next four candles also held support. Thursday’s candle engulfed that past two candles, and Friday closed near the high presenting a Bullish Doji continuation pattern. We will consider a buy above $24.00.
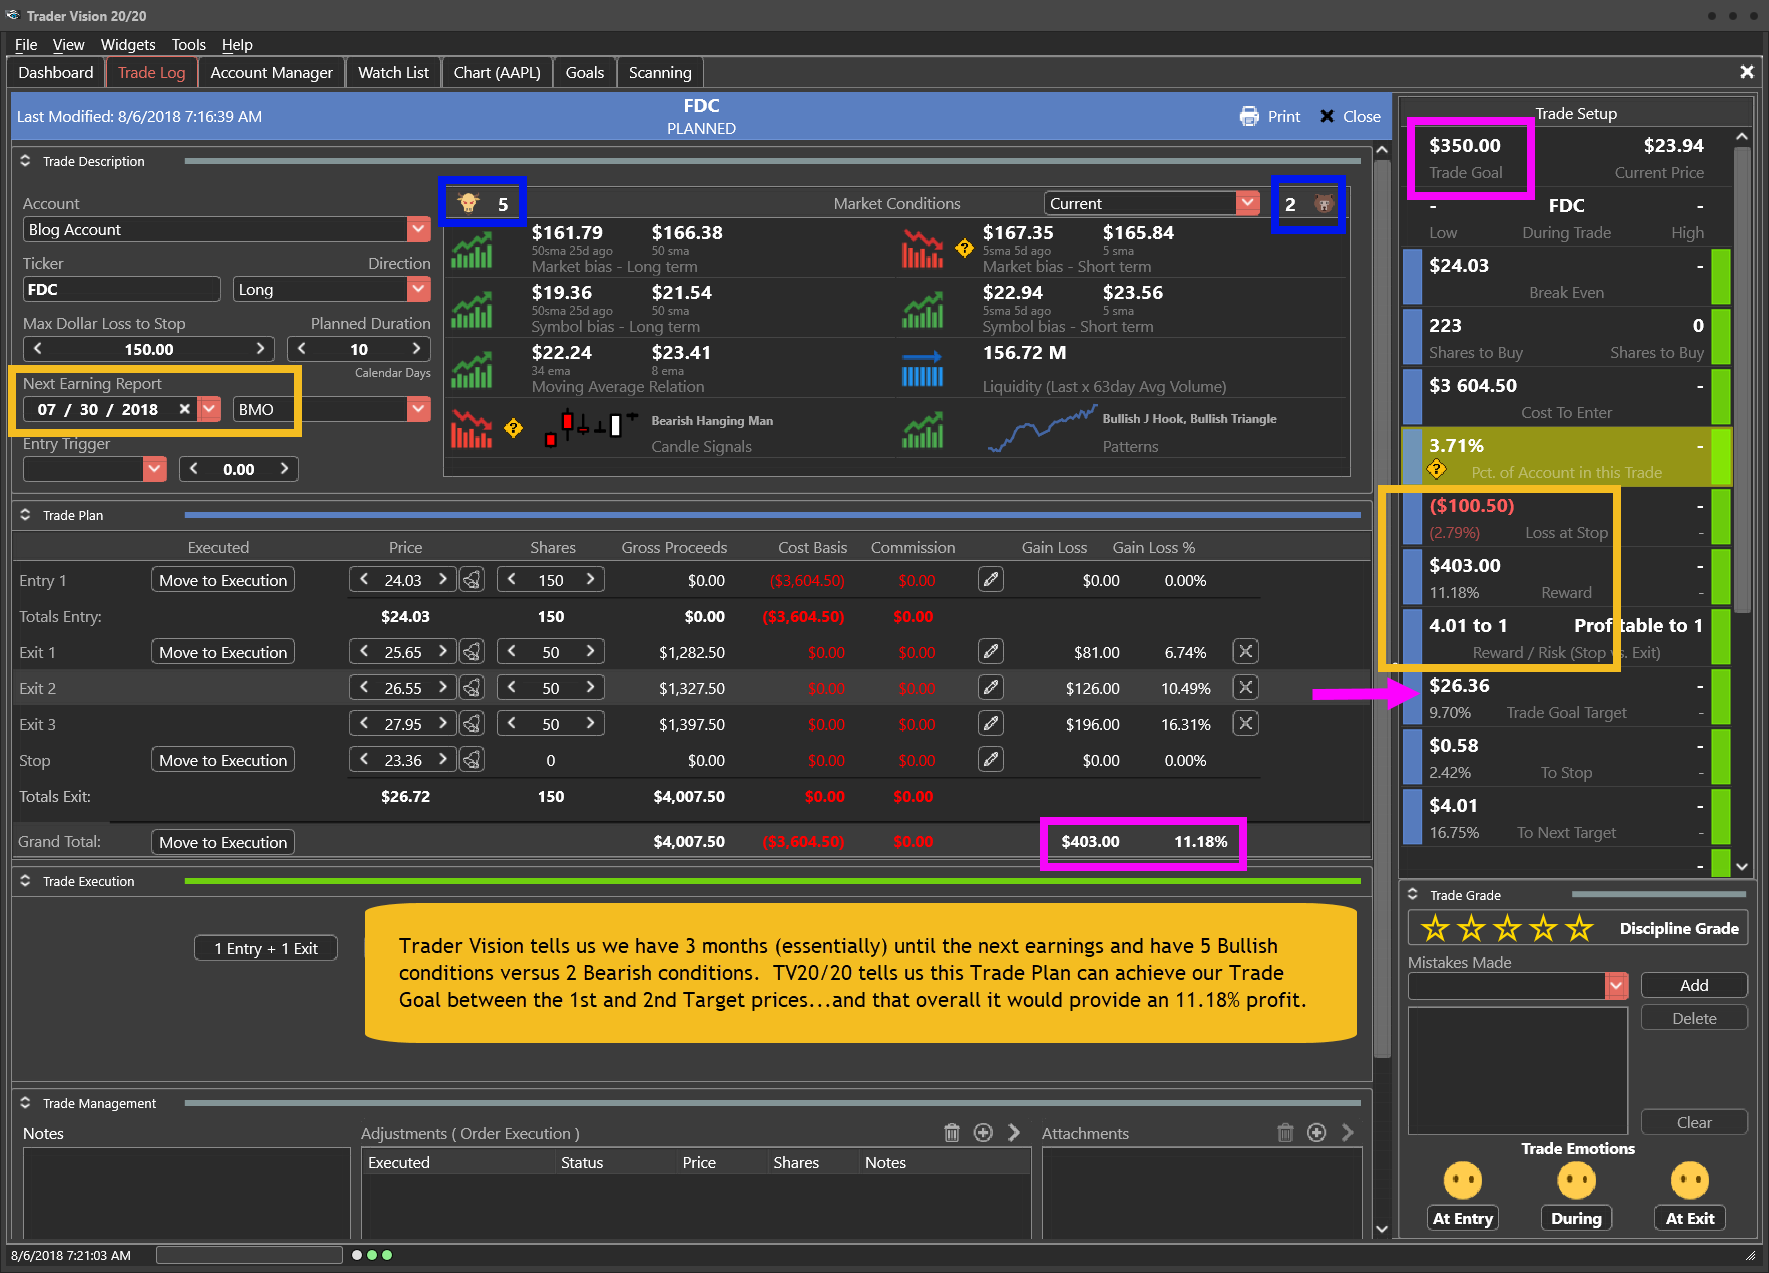
For more details on the FDC trade, please click the following link. Get the complete details including Fibonacci details TV2020 trade plan right here
Past performance is not indicative of future returns
Good Trading, Rick, and Trading Team
Monthly Trading Results Right Here Each, and every day we not only share trade ideas we also share how we plan to trade them.
Subscription Plans • Private 2-Hour Coaching
What is Rick is adding to his trade watchlist today? A 246% plus increase in 7 months can’t be all wrong. Right Here
____________________________________________________________
SPY • All-Time High Around the Corner
The chart pattern of the SPY suggests a challenge of the July 25th candle, a close above the July 25th candle could push the Bullish J-Hook continuation pattern into a little run that could challenge the January 2018 highs. Monday morning premarket and Fridays close looks as if the bulls will start the day. Follow price action and listen to what the market is saying. Good trading
****VXX – The VXX chart is back below the T-Line, no fear
Focus Trading Education
Candlesticks • Price Action • T-Line • T-Line Bands • Support • Resistance • Trend • Trendlines • Chart Patterns • Buy Box • Volatility Stops • Profit Zones • Entry Zones • Protective Stops • RBB Rounded Bottom Breakout Strategy • Pop Out of The Box Strategy • Pinball Strategy • Trade Planning, Fibonacci, Stoch/RSI
To learn more about our trading tools join us in the trading room or consider Private Coaching.
Testimonial
This is not your usual service that sends out a ton of stock recommendations, and then cherry picks the winners to show you how great they are. Hit and Run Candlesticks and Right Way Options are truly educational services. They taught me how to trade not what to trade. The entire team: Rick, Doug, Steve, and Ed are there to help and answer your questions. They are awesome. They cut years off my learning curve. And it’s a team effort. Everyone in the room (all the members) are there to help with invaluable insights and advice. The only service you will ever need. Thanks to all the team for how you have helped me and for all you do. –Jonathan Bolnick
Rare to have a service teach you how they find their choices but, HRC/RWO teach you how to fish instead of fishing for you. And, your ideas are not panned but shared, implemented, or improved. Sharing is caring. –Thomas Bradly
Past performance is not indicative of future returns
Investing and Trading involve significant financial risk and is not suitable for everyone. No communication from Hit and Run Candlesticks Inc, Right Way Option, Trader Vision 2020 or Rick Saddler, Doug Campbell, Ed Carter, Steve Risner is to be considered financial or trading advice. All information is intended for Educational Purposes Only. Terms of Service.
Rick Saddler, Doug Campbell, Ed Carter, Steve Risner is not a licensed financial adviser nor do they offer trade recommendations or advice to anyone.