Loving the KR J-Hook Setup

Loving the KR J-Hook Setup

Loving the KR J-Hook setup and rightly so. 90% of my trades have the J-Hook in it, one fashion or another. And with our account be up over 200% in the past 6-months you can see why we love the J-Hook set up. With 8.5% and a 16.5% reward target zones on KR and a 3% stop risk zone we plan our trades to work with minimum risk. Get the complete TV2020 trade plan right here

Past performance is not indicative of future returns

HRC Monthly Trading Results Right Here. Each, and every day we not only share trade ideas we also share how we plan to trade them.

MonthlyQuarterlySemi-AnnualAnnualPrivate 2-Hour Coaching

[button_1 text=”Trends%20With%20Benefits%20Workshop” text_size=”28″ text_color=”#000000″ text_bold=”Y” text_letter_spacing=”0″ subtext_panel=”Y” subtext=”Love%20The%20J-Hook%20Benefit” subtext_size=”18″ subtext_color=”#1d3fcd” subtext_bold=”Y” subtext_letter_spacing=”0″ text_shadow_panel=”N” styling_width=”40″ styling_height=”30″ styling_border_color=”#000000″ styling_border_size=”1″ styling_border_radius=”6″ styling_border_opacity=”100″ styling_gradient_start_color=”#ffff00″ styling_gradient_end_color=”#ffff00″ drop_shadow_panel=”N” inset_shadow_panel=”N” align=”center” href=”https://ob124-e13140.pages.infusionsoft.net” new_window=”Y”/]

SPY Bullish Price Action

On Friday the buyers stepped up as if they had a plan with bullish price action and this morning s futures would suggest the same. Friday’s candle (price action) busted $272.65 and held. The bullish trend is starting to look much healthier. On the Red White and Blue trend chart the 3-EMA has crossed back up through the 34-SMA, and the T-Line may follow today. This week I would like to see the SPY find good support above $276.65 and challenge $279.30. Of course, a close over $279.30 would be great!

VXX – According to the VXX chart, no fear is in sight, of course until there is fear.

Members Login for what Rick is adding to his trade watch list  Right Here

Focus Trading Education

Candlesticks • Price Action • T-Line • T-Line Bands • Support • Resistance • Trend • Trendlines • Chart Patterns • Buy Box • Volatility Stops • Profit Zones • Entry Zones • Protective Stops • RBB Rounded Bottom Breakout Strategy • Pop Out of The Box Strategy • Pinball Strategy • Trade Planning, Fibonacci, Stoch/RSI

To learn more about our trading tools join us in the trading room or consider Private Coaching.

Testimonial

This is not your usual service that sends out a ton of stock recommendations, and then cherry picks the winners to show you how great they are. Hit and Run Candlesticks and Right Way Options are truly educational services. They taught me how to trade not what to trade. The entire team: Rick, Doug, Steve, and Ed are there to help and answer your questions. They are awesome. They cut years off my learning curve. And it’s a team effort. Everyone in the room (all the members) are there to help with invaluable insights and advice. The only service you will ever need. Thanks to all the team for how you have helped me and for all you do. –Jonathan Bolnick

Rare to have a service teach you how they find their choices but, HRC/RWO teach you how to fish instead of fishing for you. And, your ideas are not panned but shared, implemented, or improved. Sharing is caring. –Thomas Bradly


Past performance is not indicative of future returns

Investing and Trading involve significant financial risk and is not suitable for everyone. No communication from Hit and Run Candlesticks Inc, Right Way Option, Trader Vision 2020 or Rick Saddler, Doug Campbell, Ed Carter, Steve Risner is to be considered financial or trading advice. All information is intended for Educational Purposes Only. Terms of Service.

Rick Saddler, Doug Campbell, Ed Carter, Steve Risner is not a licensed financial adviser nor do they offer trade recommendations or advice to anyone.


Bullish Open

Bullish Open

bullish openThe Futures are pointing to a bullish open this morning with world markets follow US Friday rally.  Political trade war rhetoric was kept to a minimum over the weekend allowing the markets to focus and follow-through on the very strong employment situation report.  With the odd holiday week behind us, volumes should improve as the markets look forward to 3rd quarter earnings season kicking off this coming Friday with several big banks reporting.

This morning the Dow is gaping up right into its 50-day average that could serve as resistance so it would be wise to exercise a little caution because we are not out of the woods just yet.  There is no need to rush or predict, wait for proof that buyers are stepping in supporting this morning gap.  There is still technical damage to repair, but the positive price action in the QQQ, SPY, and IWM are encouraging that the bulls are finding their footing.

On the Calendar

A light day on the Economic Calendar to kick off this week of trading with no expected market-moving reports.  We have a Fed Speaker at 9:10 AM, three bond events between 11:00 AM & 11:30 AM, TD Ameritrade IMX at 12:30 PM with Consumer Credit at 3:00 PM closing the calendar day.

We have just nine companies reporting earnings today with the most notable being HELE coming out before the bell today.

Action Plan

We got through the weekend without increasing trade war concerns.  Asian & European markets were bullish overnight following our Friday rally based on good jobs numbers and a huge improvement in the international trade deficit.  As I write this mornings blog, the Dow Futures are pointing to a  gap up open of more than 100 points at the open.  With nothing on the Economic or Earnings calendar likely to change that a follow-through of Friday’s bullishness is likely as long as politics stay out of the news.

The Dow, however, presents a bit of a conundrum this morning gaping up yet still under its 50-day moving average.  The exact place where a failure could occur.  The SPY, QQQ, and IWM are in a far stronger pattern having held their 50-day averages and finding buyers to rally them off these key supports.  Keep in mind the SPY, QQQ and IWM all have price resistance levels above to watch closely.  With the Holiday week now behind us and 3rd quarter earnings beginning at the end of the week, volume should show improvement and hopefully so will daily whipsaw in prices.  Although I’m hoping price action will now begin to improve, we must still exercise caution when we see pre-market gaps into resistance levels.  Whipsaws and full reversals are possible.  After the morning rush watch for clues that buyers are stepping in supporting the gap.  Remember the old saying, fool me once shame on you, fool me twice shame on me.

Trade wisely,

Doug

[button_2 color=”green” align=”center” href=”https://youtu.be/5lUgTMXHYSg”]Morning Market Prep Video[/button_2]
Thoughts On The Market

Thoughts On The Market

The trade war has begun, it will be interesting to see how the market acts today. Yesterday the SPY closed over the 50-SMA and the T-Line but below the important $273.65 resistance line. The DIA’s still below the 50-SMA, and the 34-EMA is now below the 50-SMA. The QQQ’s closed above the T-Line, 34-EMA and the 50-SMA but below the $174.90 resistant line. IWM was the winner yesterday showing bullish follow through from the bullish engulfing. IWM also closed above the T-Line, 34-EMA and the 50-SMA. All in all, I would call this market sketchy at best. Trade cautious, trade small, trade with the best.

Trading Results

The past six months of trading has been pretty good if your trading foundation was solid and you stuck to your rules. Even with the SPY closing below it’s May high our Road To Wealth Account increased by another 16% and a YTD increase of 198.95%. To see the results and the account Click Right Here

Trading platform and Brokerage

I often get asked what trading platform and brokerage I use: Well the brokerage I use is Tradier, and the trading platform is TradeHawk. With only a $159.00 charge which includes unlimited equity and option trades, I couldn’t be happier. If you’re interested in saving a bucket of money Download TradeHawk and Try It Out Free

If you do let me know and I will hook you up with something pretty cool, you can have access to every trade I make instantly.

Today’s Trader Vision Trade Plan Right Here

Updated HRC Monthly Trading Results Right Here

Trend With Benefits WorkShop July 26, 2018

Doug is a successful stock and options trader and heads up the Right Way Options Trading Room. He has been involved in the market for 28 years and has fully supported his family from trading profits for the past 13 years. Doug is a master of trading trending charts and taking advantage of the benefits they offer. He uses simple ‘Naked Charts’ with minimal indicators and the focus on the most important element of trading – Price. Helping other traders realize their dreams is Doug’s way of paying it forward. Take advantage of this learning opportunity from someone who has done the work to create success in trading.

[button_2 color=”green” align=”center” href=”https://ob124-e13140.pages.infusionsoft.net” new_window=”Y”]Trends With Benefits • Financial Freedom is Fantastic[/button_2]


MonthlyQuarterly Semi-AnnualAnnualPrivate 2-Hour Coaching

Past Performance Is No Guarantee of Future Results

Investing and Trading involve significant financial risk and is not suitable for everyone. No communication from Hit and Run Candlesticks Inc, Right Way Option, Trader Vision 2020 or Rick Saddler, Doug Campbell, Ed Carter, Steve Risner is to be considered financial or trading advice. All information is intended for Educational Purposes Only. Terms of Service.

Rick Saddler, Doug Campbell, Ed Carter, Steve Risner is not a licensed financial adviser nor does he offer trade recommendations or advice to anyone.

*************************************************************************************


SONC Setup and Trade Plan

Normally we don’t do a featured trade on Friday’s. However, with no trade on Tuesday (half day) and Wednesday (holiday), I decided to put out a trade idea today.  Today’s Featured Trade Idea is SONC.

You can see Rick’s detailed review in the trading room at 9:10am Eastern.  For now, here is my analysis and a potential trade plan made using our Trader Vision 20/20 software.

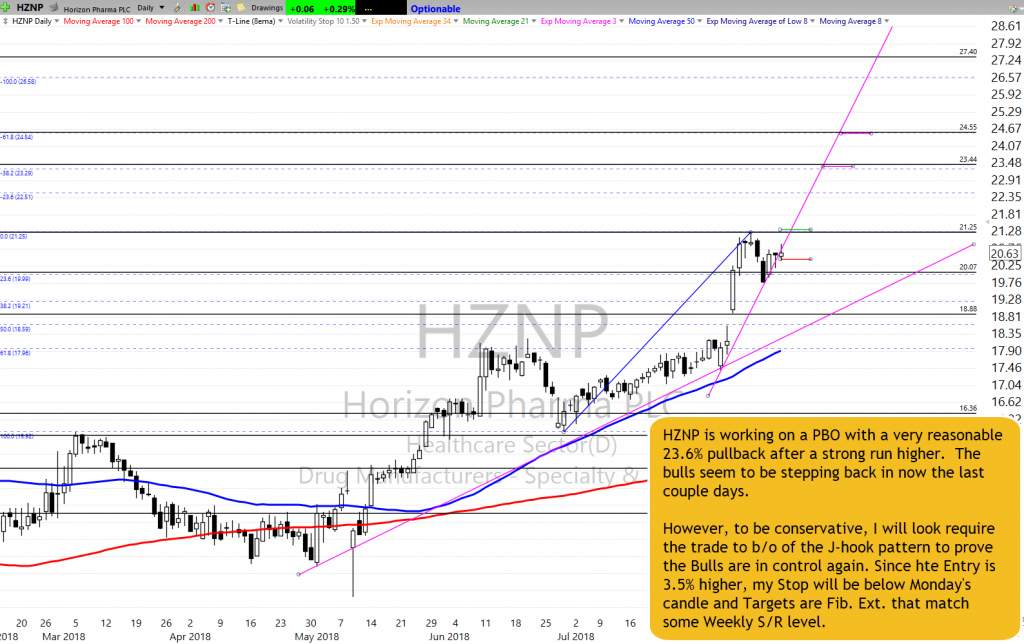
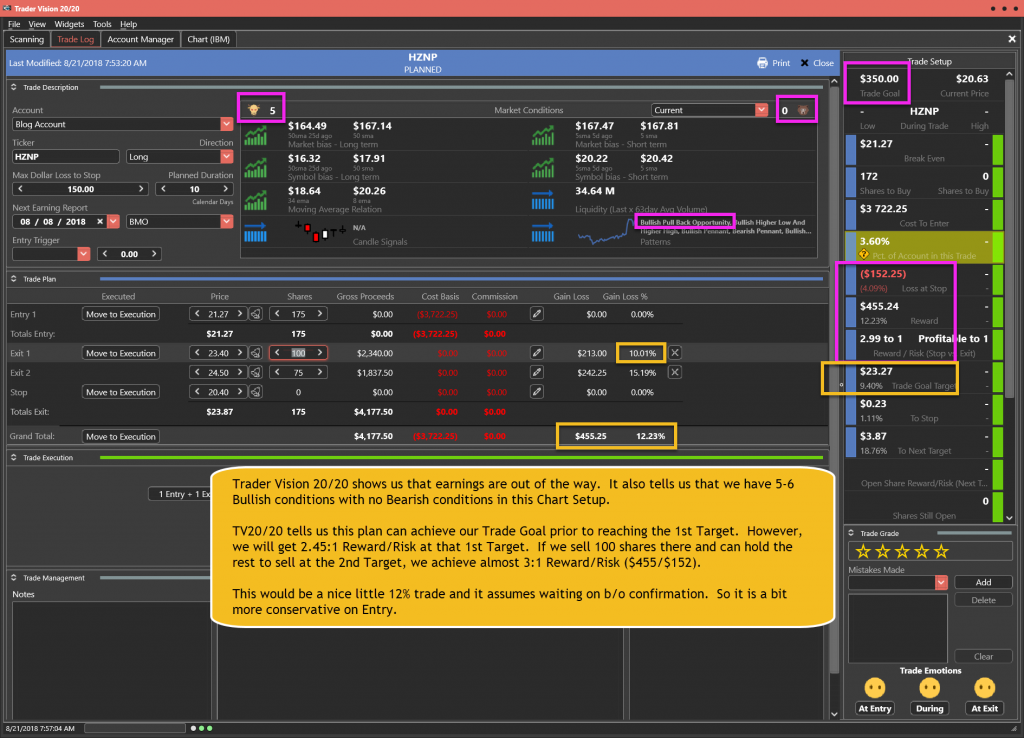
SONC has no exposure to International Trade and as a fast food restaurant, less exposure to economic or political news. So, relatively speaking it has lower weekend headline risk. I will be looking for Entry about 15 cents above b/o of the J-hook pattern, using Fib Targets since we are near all-time highs.  Below is my markup of the chart and the trade plan as laid out by Trader Vision 20/20.  As a bonus, if you click the green button below, you’ll be able to watch a video of the chart markup and trade planning process.

Don’t forget, Friday are “Open House” Days in the Trading Room. 

Please be our guest and join us in Trading Room # 1 (No password required)


The  SONC Trade Setup – As of 7-5-18

SONC Setup as of 7-5-18


The  Trade Plan


SONC Plan for 7-6-18

Note how Trader Vision 20/20 does so much of the work for you.  Knowing the overall risk of the position size, risk to Stop out and Reward possible at each Target can help a great deal with controlling our emotions.  Knowing the Risk is low and the potential Reward good.  Knowing the Risk, Reward and how far a stock must move to reach our goal…before a trade…really takes the pressure off.  No guesswork.  No surprises.  No emotional roller coaster.

To see a short video of this trade’s chart markup and trade planning, click the button below.


[button_2 color=”light-green” align=”center” href=”https://youtu.be/oP2Dl60QEO4″ new_window=”Y”]Trade Plan Video[/button_2]


Put the power to Trader Vision 20/20 to work for you…

[button_2 color=”orange” align=”center” href=”https://hitandruncandlesticks.com/product/trader-vision-20-20-monthly-subscription2/” new_window=”Y”]TV20/20 Software[/button_2]


Testimonial

Trader Vision immediately simplified the process…immediately it provided that information and guidance to me. I knew what I would risk for how much reward, I began taking trades off at the 1st target, 2nd target, I was no longer holding all my trades for the homerun. I also began implementing the stop losses if and when they were reached, not just hoping the stock would recover.  It then became easier to see what patterns were working for me and which were not.  It provided a much more relaxed and stress-free environment. –Joan G


***************************************************************************************************

Investing and Trading involve significant financial risk and are not suitable for everyone. Ed Carter is not a licensed financial adviser nor does he offer trade recommendations or investment advice to anyone. No communication from Hit and Run Candlesticks Inc. is to be considered financial or trading advice. All information is intended for Educational Purposes Only. Terms of Service.

***************************************************************************************************

Choppy Week

Choppy Week

Choppy WeekI don’t know about you, but I will be happy to see this choppy, week come to an end.  I have spent the better part of the last 2-weeks talking about caution and avoidance of the choppy price action.  That caution has proved to have been correct, but just like everyone else I’m tired of the chop and hope next will be better as traders return from extended holiday vacations.

However, I plan to remain cautious into the weekend with the uncertainty of trade war rhetoric ramping up.  As of yesterday, every one of our positions held unrealized gains so I will be far more focus on taking profits today than I will be about adding risk ahead of the weekend.  With 3rd quarter earnings season kicking off next week the market will at least have something else other than political wrangling from which to draw inspiration.

On the Calendar

We kick off the Economic Calendar this Friday with two potentially market-moving the reports at 8:30 AM Eastern.  First, consensus expects the Employment Situation report to show new job growth of 190,000 with the unemployment rate down to 3.8 percent.  Hourly earnings are also moving up in June with consensus suggesting a 0.3 increase and a year-on-year rate up to 2.8 percent.  The International Trade deficit is expected to narrow sharply to $43.7 with a 2.1 percent increase for exports while the imports only gained 0.2 percent.  After that, we have the EIA Natural Gas Report @ 10:30 AM, the Baker-Hughes Rig Count @ 1:00 PM and Treasury STRIPS @ 3:00 PM.

A very light day on the Earnings Calendar with only three companies reporting.  Keep in mind is the calm before the storm of 3rd quarter earnings which officially kicks off next week when some of the big banks report.

Action Plan

I plan to wrap up the end of this odd trading week much the same as it began with caution.  Yesterday day ending on a positive note but whipped several times on anemic volume.  Currently, Futures are pointing to a negative open as the market reacts to the tariff battle.  Keep in mind with the Employment Situation number which comes out before the open that could quickly change.

Next Friday the 3rd quarter earnings season will get underway giving the market more to think about other than political uncertainty.  Perhaps we will finally exit this choppy consolidation and pick a direction next week.  Volume should improve next week as traders return from their extended holiday vacations and price action should become more deliberate without all the whipsaws.  Trade war rhetoric could ramp up this weekend as both the US and China lob threats back an forth.  Plan your risk into the weekend carefully.

Trade Wisely,

Doug

[button_2 color=”green” align=”center” href=”https://youtu.be/-Wp3PzZqSuw”]Morning Market Prep Video[/button_2]
June 2018 Trading Results Road To Wealth

June 2018 Trading Results

Our June 2018 trading results have been posted Click Here to take a look. For 2018, we have decided to do a better job demonstrating the success of the Hit and Run Candlesticks and Right Way Options trading methods. So, Rick set up a small account ($5,100) intended to give a small trader an idea of what is possible. As each month comes to a close, we’ll post the account statement to allow you to see the actual results achieved.

YTD 198.95%

HRC Monthly Trading Results Right Here


Past performance is not indicative of future returns

Investing and Trading involve significant financial risk and is not suitable for everyone. No communication from Hit and Run Candlesticks Inc, Right Way Option, Trader Vision 2020 or Rick Saddler, Doug Campbell, Ed Carter, Steve Risner is to be considered financial or trading advice. All information is intended for Educational Purposes Only. Terms of Service.

Rick Saddler, Doug Campbell, Ed Carter, Steve Risner is not a licensed financial adviser nor do they offer trade recommendations or advice to anyone.


Cradle • Pop Out of The Box Patterns ►Free Trading Room today Thursday 7/5/18

Cradle • Pop Out of The Box Patterns

On the 2-day chart, NIHD has produced a Bullish Cradle and Pop Out of The Box Patterns. The daily chart has drawn a breakout with a 2 bar flag with a breakout as well. The Volatility Stop has turned green. These are the kind of conditions we look for before we have a reason to buy. Check out the TV2020 Trade plan for details

Free Live Trading Room, Right Here  Today and Friday

Trader Vision Trade Plan Right Here

HRC Monthly Trading Results Right Here

MonthlyQuarterlySemi-AnnualAnnual Private 2-Hour Coaching

SPY Stoped By The Volatility Stop

On Tuesday the price action was controlled by the sellers, price could not get past the Volatility Stop or the 34-EMA and closed below the 50-SMA. Today’s futures are suggesting the buyers want there ground back and may try to close above the 34-EMA. As I said last week and Monday, and Tuesday until the buyers can get price above $273.65 they have nothing. The Red White and Blue chart is still in negative territory, but not full-blown bearish; this suggests choppy back and forth until the bear or bull gives up.

VXX – The VXX chart at Tuesday’s close suggest bullishness, today’s morning futures suggest the bullishness has a weekend. Above $34.15 the VXX chart still has gas in the tank.

Rick’s Trade-Ideas Reserved for Members Right Here

Focus Trading Education

Candlesticks • Price Action • T-Line • T-Line Bands • Support • Resistance • Trend • Trendlines • Chart Patterns • Buy Box • Volatility Stops • Profit Zones • Entry Zones • Protective Stops • RBB Rounded Bottom Breakout Strategy • Pop Out of The Box Strategy • Pinball Strategy • Trade Planning, Fibonacci, Stoch/RSI

To learn more about our trading tools join us in the trading room or consider Private Coaching.

Testimonial

This is not your usual service that sends out a ton of stock recommendations, and then cherry picks the winners to show you how great they are. Hit and Run Candlesticks and Right Way Options are truly educational services. They taught me how to trade not what to trade. The entire team: Rick, Doug, Steve, and Ed are there to help and answer your questions. They are awesome. They cut years off my learning curve. And it’s a team effort. Everyone in the room (all the members) are there to help with invaluable insights and advice. The only service you will ever need. Thanks to all the team for how you have helped me and for all you do. –Jonathan Bolnick

Rare to have a service teach you how they find their choices but, HRC/RWO teach you how to fish instead of fishing for you. And, your ideas are not panned but shared, implemented, or improved. Sharing is caring. –Thomas Bradly


Past performance is not indicative of future returns

Investing and Trading involve significant financial risk and is not suitable for everyone. No communication from Hit and Run Candlesticks Inc, Right Way Option, Trader Vision 2020 or Rick Saddler, Doug Campbell, Ed Carter, Steve Risner is to be considered financial or trading advice. All information is intended for Educational Purposes Only. Terms of Service.

Rick Saddler, Doug Campbell, Ed Carter, Steve Risner is not a licensed financial adviser nor do they offer trade recommendations or advice to anyone.


Setup and Trade Plan

Today’s Featured Trade Idea is NIHD.

You can read more about this trade in Rick’s blog post here.  Members can also see his detailed review in the trading room at 9:10am Eastern.  For now, here is my analysis and a potential trade plan made using our Trader Vision 20/20 software.

NIHD has been a screaming Bullish trend since December. After a pullback and consolidation in May, it has resumed the strong trend. On Tue. it printed a Bull Engulfing signal after the 2-day pullback to trend.  I’ll look for a breakout Entry with Stop just below the candle bodies of last Thu. and Fri.  First target is just prior to the $4.69 resistance (and 61.8% Fib Ext.) and a second target mid-way between the 100% Ext. and $5.56 resistance level.  Below is my markup of the chart and the trade plan as laid out by Trader Vision 20/20.  As a bonus, if you click the green button below, you’ll be able to watch a video of the chart markup and trade planning process.

Don’t forget, Thursday and Friday are “Open House” Days in the Trading Room. 

Please be our guest and join us in Trading Room # 1 (No password required)


The  NIHD Trade Setup – As of 7-3-18

NIHD as of 7-3-18


The  Trade Plan #1

The  Trade Plan #2

Note how Trader Vision 20/20 does so much of the work for you.  Knowing the overall risk of the position size, risk to Stop out and Reward possible at each Target can help a great deal with controlling our emotions.  Knowing the Risk is low and the potential Reward good.  Knowing the Risk, Reward and how far a stock must move to reach our goal…before a trade…really takes the pressure off.  No guesswork.  No surprises.  No emotional roller coaster.

To see a short video of this trade’s chart markup and trade planning, click the button below.


[button_2 color=”light-green” align=”center” href=”https://youtu.be/xlH70htVRHE” new_window=”Y”]Trade Plan Video[/button_2]


Put the power to Trader Vision 20/20 to work for you…

[button_2 color=”orange” align=”center” href=”https://hitandruncandlesticks.com/product/trader-vision-20-20-monthly-subscription2/” new_window=”Y”]TV20/20 Software[/button_2]


Testimonial

Trader Vision immediately simplified the process…immediately it provided that information and guidance to me. I knew what I would risk for how much reward, I began taking trades off at the 1st target, 2nd target, I was no longer holding all my trades for the homerun. I also began implementing the stop losses if and when they were reached, not just hoping the stock would recover.  It then became easier to see what patterns were working for me and which were not.  It provided a much more relaxed and stress-free environment. –Joan G


***************************************************************************************************

Investing and Trading involve significant financial risk and are not suitable for everyone. Ed Carter is not a licensed financial adviser nor does he offer trade recommendations or investment advice to anyone. No communication from Hit and Run Candlesticks Inc. is to be considered financial or trading advice. All information is intended for Educational Purposes Only. Terms of Service.

***************************************************************************************************