Blue Ice Failure Leads To The Deuces

Blue Ice Failure Leads To The Deuces

Short set-up, Blue Ice Failure (BIF) leads to the Deuces (200-SMA and 200-FWL200) target zone many times and has become a favorite trade of mine. UA is in such a chart pattern, and I see about a 15 – 16% stock trade and could be a 75% plus option trade.  And possible more below the 200-SMA. Here are a few tools to use and focus on: Candlesticks • Price Action • T-Line • T-Line Bands • Support • Resistance.

For more details on the UA trade, please click the following link. Get the complete details including Fibonacci details TV2020 trade plan right here

Past performance is not indicative of future returns

Good Trading, Rick, and Trading Team

HRC Monthly Trading Results Right Here  Each, and every day we not only share trade ideas we also share how we plan to trade them.

Subscription PlansPrivate 2-Hour Coaching


SPY • Profit Taking Has Extended

The selling in the SPY extended three days yesterday and today could be four. Price closed yesterday below the T-Line, but above support, it is clear the buyers and sellers have some negotiating too do.  The daily V-Stop has turned red while the 2-day chart is on V-Stop and T-Line support. With AAPL reporting tonight and the FOMC meeting starting today, no doubt there will be winners and losers.

****VXX – Last weeks double bottom, Doji, Bullish Engulf had a little follow-through yesterday. The VXX chart is still trending down, but the FEAR team is trying to carve out a bottom. We will see, stay tuned.

What Rick is adding to his trade watch list Right Here

Focus Trading Education

Candlesticks • Price Action • T-Line • T-Line Bands • Support • Resistance • Trend • Trendlines • Chart Patterns • Buy Box • Volatility Stops • Profit Zones • Entry Zones • Protective Stops • RBB Rounded Bottom Breakout Strategy • Pop Out of The Box Strategy • Pinball Strategy • Trade Planning, Fibonacci, Stoch/RSI

To learn more about our trading tools join us in the trading room or consider Private Coaching.

Testimonial

This is not your usual service that sends out a ton of stock recommendations, and then cherry picks the winners to show you how great they are. Hit and Run Candlesticks and Right Way Options are truly educational services. They taught me how to trade not what to trade. The entire team: Rick, Doug, Steve, and Ed are there to help and answer your questions. They are awesome. They cut years off my learning curve. And it’s a team effort. Everyone in the room (all the members) are there to help with invaluable insights and advice. The only service you will ever need. Thanks to all the team for how you have helped me and for all you do. –Jonathan Bolnick

Rare to have a service teach you how they find their choices but, HRC/RWO teach you how to fish instead of fishing for you. And, your ideas are not panned but shared, implemented, or improved. Sharing is caring. –Thomas Bradly


Past performance is not indicative of future returns

Investing and Trading involve significant financial risk and is not suitable for everyone. No communication from Hit and Run Candlesticks Inc, Right Way Option, Trader Vision 2020 or Rick Saddler, Doug Campbell, Ed Carter, Steve Risner is to be considered financial or trading advice. All information is intended for Educational Purposes Only. Terms of Service.

Rick Saddler, Doug Campbell, Ed Carter, Steve Risner is not a licensed financial adviser nor do they offer trade recommendations or advice to anyone.


UA Setup and Trade Plan

Before I forget, please join me for the Trader Vision 20/20 Weekly Workshop.

Wed. at 4:15 pm Eastern in Room #3 (no password needed)

http://hitandruncandlesticks.webinato.com/room3

 (This week, I will be providing a first look at our new Scanning tool…and how it will help you find the right trades.)


Today’s Featured Trade Idea is UA (short).

You can read more about this trade in Rick’s blog post here.  Members can also see his detailed review in the trading room at 9:10am Eastern.  For now, here is my analysis and a potential trade plan made using our Trader Vision 20/20 software.

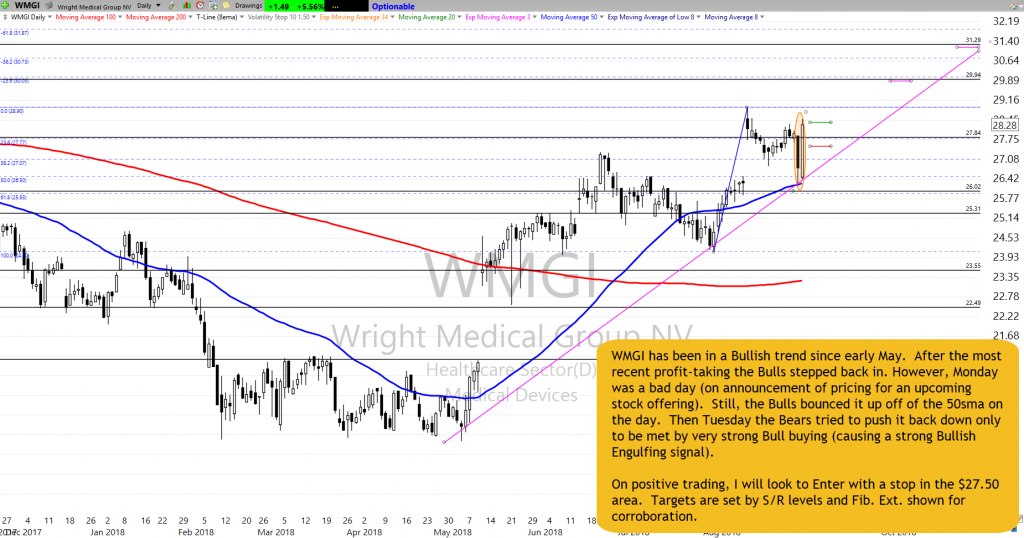
UA has been trending down for over a month. On Monday, it broke down out of a “Dreaded h” pattern, confirming the “Blue Ice Failure” pattern from Friday an taking out the last Support level for awhile.  I will be looking for a Short Entry inside the lower half of Monday’s candle and expecting the trend to continue. The Stop will be above the area breached Friday (now potential Resistance).  Note that the 200sma should be near Target #2 by the time it is reached.

Trader Vision tells us we have 3mo. until earnings and have a lot of Bearish conditions in favor of this Short Trade.  It also told us we needed to re-evaluate the Stop. After doing so, a logical Stop at $19.46 gave us better than 2:1 Reward/Risk to the first Target. In this case, we can risk $90 for a chance to make $369 if we reach both Targets.

Below is my markup of the chart and the trade plan as laid out by Trader Vision 20/20.  As a bonus, if you click the green button below, you’ll be able to watch a video of the chart markup and trade planning process.


The UA Trade Setup – As of 7-30-18

UA as od 7-30-18


The Trade Plan

UA Trade Plan for 7-31-18


Note how Trader Vision 20/20 does so much of the work for you.  Knowing the ratio of Bullish Conditions to Bearish ones as well as the overall risk of the position size, risk to Stop out and the Reward possible at each Target price can help a great deal with controlling our emotions.  Knowing the dollar impact of every scenario ahead of time, allows us to make calm decisions during the trade.  It really takes the pressure off.  No guesswork.  No surprises.  No emotional roller coaster.

To see a short video of this trade’s chart markup and trade planning, click the button below.


[button_2 color=”light-green” align=”center” href=”https://youtu.be/kfiA95hy_jI” new_window=”Y”]Trade Plan Video[/button_2]


Put the power to Trader Vision 20/20 to work for you…

[button_2 color=”orange” align=”center” href=”https://hitandruncandlesticks.com/product/trader-vision-20-20-monthly-subscription2/” new_window=”Y”]TV20/20 Software[/button_2]


Testimonial

Trader Vision immediately simplified the process…immediately it provided that information and guidance to me. I knew what I would risk for how much reward, I began taking trades off at the 1st target, 2nd target, I was no longer holding all my trades for the homerun. I also began implementing the stop losses if and when they were reached, not just hoping the stock would recover.  It then became easier to see what patterns were working for me and which were not.  It provided a much more relaxed and stress-free environment. –Joan G


***************************************************************************************************

Investing and Trading involve significant financial risk and are not suitable for everyone. Ed Carter is not a licensed financial adviser nor does he offer trade recommendations or investment advice to anyone. No communication from Hit and Run Candlesticks Inc. is to be considered financial or trading advice. All information is intended for Educational Purposes Only. Terms of Service.

***************************************************************************************************

Tough Decisions

Tough Decisions

Tough DecisionsWith so much data coming out today and the beginning of the FOMC meeting traders will have some tough decisions to make.  Toss in after the bell AAPL earnings report with the power to gap the Wednesday open planning your risk becomes very important.  A tough decision to be sure.

Asian and European markets had mixed results overnight, and although the Futures are currently pointing to a slightly bullish open a little fear is creeping into the market.  I continue to suggest caution, especially for inexperienced traders.  With so much data dumped on the market all at once remember that even the best of signals can quickly reverse so plan your risk carefully.

On the Calendar

We kick off a big day of potential market-moving reports.  First, Personal Income and Outlays are expected to rise 0.4 percent with consensus suggesting the year-on-year rate of 2.3 percent.  Also at 8:30 the Employment Cost Index is expected to rise 0.7 percent with the year-on-year number first quarter coming in at a ten year high of 2.7%.  At 9:00 AM the CoreLogic Case-Shiller expects to show a monthly gain of 0.3 percent in home prices with the but the year-on-year number staying flat at 6.6 percent.   The Chicago PMI expects a slight pullback in July to 62.3 vs. the 64.1 June reading at 9:45 AM.  Finally, the Consumer Confidence report at 10:00 AM expect steady strength with a reading expected at 127.0 for in July vs. 126.4 for June.  If that were not enough, we have the beginning of the 2-day FOMC meeting, Read Book @ 8:55 AM, Stat Street Confidence Index @ 10:00 AM and a Bond Auction @ 11:30 AM.

On the Earnings Calendar, we have more than 230 companies reporting so keep checking earning dates against companies you own and have a plan to protect yourself.

Action Plan

Yesterday was a bit nasty with NASDAQ stock under pressure pushing the QQQ down and testing a key level of support.  The DIA, SPY, and IWM also came under selling pressure and raising concern that the current uptrend may soon end if the bulls don’t step in and support prices soon.

Currently, Futures markets are trying to put on a brave face indicating a slight bullish open, but with so many reports in both earnings and economic calendar, any is possible.  I would suggest caution until we see clear signals from the bulls that the pullback is over.  Remember, AAPL reports after the bell today and can move the market, so plan for the high probability of a substantial gap open on Wednesday.  Also, keep in mind after the morning rush we could see choppy price action as we wait for the FOMC decision on interest rates.

Trade Wisely,

Doug

[button_2 color=”green” align=”center” href=”https://youtu.be/T0LtKTYIuWU”]Morning Market Prep Video[/button_2]
Signs of Stress

Signs of Stress

Signs of StressThe NASDAQ and Russell revealed signs of stress on Friday closing the day with bearish engulfing candles and breaking short-term supports.  With the VIX showing signs of fear stating bubbling up it would be wise to approach the market with a little caution this morning.  More than 1000 companies report this week volatility is likely to be high with fast price action, morning gaps, and intraday whipsaws.

If that’s not enough, we have a busy Economic Calendar which includes an FOMC meeting and a significant number of potential market-moving reports.  Return your tray tables to their upright and locked position and make sure your seat belts are fastened securely because the odds of turbulence are high.  Plan your risk carefully.

On the Calendar

Pending Home Sales will kick off the market-moving reports this week at 10:00 AM Eastern.  Consensus suggests we will see an increase of 0.8 percent recovering from a 0.5 percent decline in May.  We have Dallas Fed Mfg. Survey @ 10:30 AM, three bond events between 11:00 & 11:30 AM, with Farm Price at 3:00 PM to close the calendar day.

We have another really big week of earnings with Monday’s calendar showing 152 companies stepping up to report.  CAT & L are among the reports before the bell with AABA & NTRI included coming in after the bell.

Action Plan

The DIA and SPY managed to hold on to their trends cling to current price support levels.  However, the QQQ and IWM gave up short-term supports with big bearish engulfing candles that suggest at a minimum a lower low is possible today.  Asian markets closed down across the board last night while European markets look to follow suit with the FTSE, DAX & CAC all lower this morning.  Of course, anything is possible with so many companies reporting before the bell, but the US Futures are currently pointing to flat open.

With the Nasdaq and Russell clearly showing signs of stress and the VIX indicating an increase in fear I would suggest approaching the market with a little caution.  A good round of reports this week could easily lift us out of danger, but with the indexes, so close to the edge, a few key reports could easily push them off.  Keep a close eye on price action for clues and plan to see whipsaws and some fast price action as we wrap up July.

Trade Wisely,

Doug

[button_2 color=”green” align=”center” href=”https://youtu.be/sRCJAxG1Iv4″]Morning Market Prep Video[/button_2]
RBB Pattern Presents a Pull Back Opportunity (PBO)

RBB Presents a Pull Back Opportunity (PBO)

The AKRX chart is an RBB pattern that has presented us with a pullback opportunity (PBO) that is about 30% from the full swing target zone. With the J-Hook continuation pattern forming, over $18.25 we see a high probability of the minor target zones tagged followed by the full swing target with normal profit taking along the way.

For more details on the AKRX trade, please click the following link. Get the complete details including Fibonacci details TV2020 trade plan right here

Past performance is not indicative of future returns

Good Trading, Rick and Trading Team


HRC Monthly Trading Results Right Here  Each, and every day we not only share trade ideas we also share how we plan to trade them.

HRC and RWO Membership PricingPrivate 2-Hour Coaching

SPY And Profit Taking

The SPY saw a little profit taking Friday on an Evering Star Type candle. Friday was the first day fifteen days that produced a red V-Stop Dot. Price did hold the T-Line, so the big question today is will there follow through below Friday’s close? The futures are not looking very strong at 7:30 Am this morning so we could see a lower low. The hourly Dotted Duece is at $278.60

****VXX – Ok so the VXX close over the T-Line Friday and painted a Bullish Engulf, over $32.20 would suggest the grim reaper is lurking.

Members Login for what Rick is adding to his trade watch list Right Here

Focus Trading Education

Candlesticks • Price Action • T-Line • T-Line Bands • Support • Resistance • Trend • Trendlines • Chart Patterns • Buy Box • Volatility Stops • Profit Zones • Entry Zones • Protective Stops • RBB Rounded Bottom Breakout Strategy • Pop Out of The Box Strategy • Pinball Strategy • Trade Planning, Fibonacci, Stoch/RSI

To learn more about our trading tools join us in the trading room or consider Private Coaching.

Testimonial

This is not your usual service that sends out a ton of stock recommendations, and then cherry picks the winners to show you how great they are. Hit and Run Candlesticks and Right Way Options are truly educational services. They taught me how to trade not what to trade. The entire team: Rick, Doug, Steve, and Ed are there to help and answer your questions. They are awesome. They cut years off my learning curve. And it’s a team effort. Everyone in the room (all the members) are there to help with invaluable insights and advice. The only service you will ever need. Thanks to all the team for how you have helped me and for all you do. –Jonathan Bolnick

Rare to have a service teach you how they find their choices but, HRC/RWO teach you how to fish instead of fishing for you. And, your ideas are not panned but shared, implemented, or improved. Sharing is caring. –Thomas Bradly


Past performance is not indicative of future returns

Investing and Trading involve significant financial risk and is not suitable for everyone. No communication from Hit and Run Candlesticks Inc, Right Way Option, Trader Vision 2020 or Rick Saddler, Doug Campbell, Ed Carter, Steve Risner is to be considered financial or trading advice. All information is intended for Educational Purposes Only. Terms of Service.

Rick Saddler, Doug Campbell, Ed Carter, Steve Risner is not a licensed financial adviser nor do they offer trade recommendations or advice to anyone.


AKRX Setup and Trade Plan

Today’s Featured Trade Idea is AKRX.

You can read more about this trade in Rick’s blog post here.  Members can also see his detailed review in the trading room at 9:10am Eastern.  For now, here is my analysis and a potential trade plan made using our Trader Vision 20/20 software.

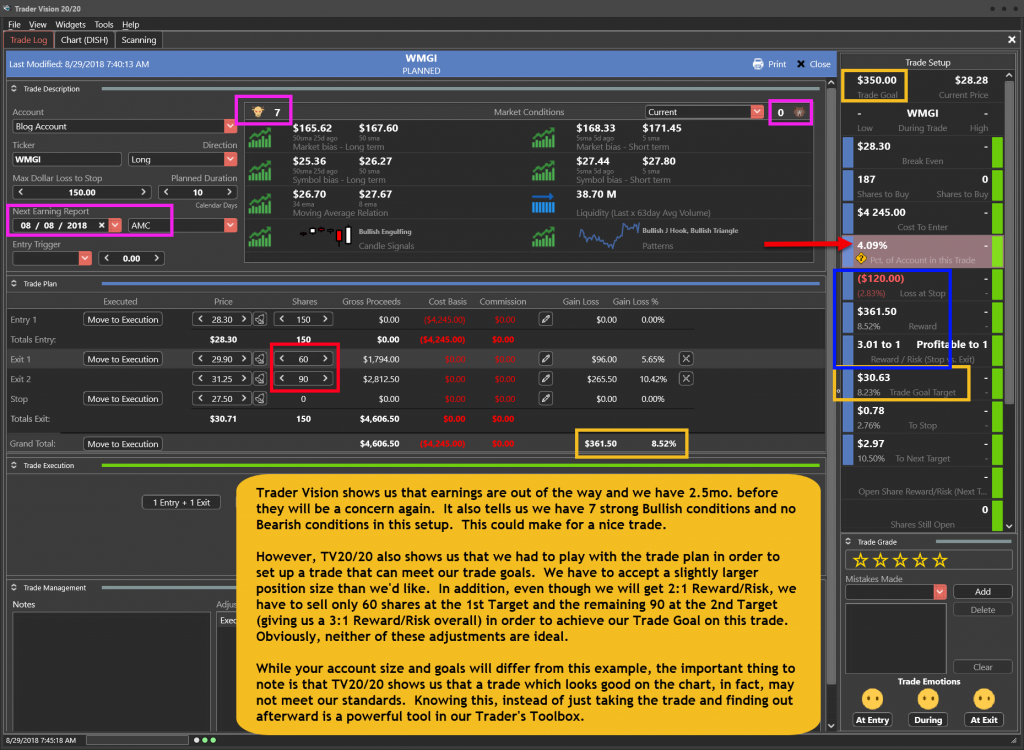
AKRX printed a Trader’s Best Friend type signal Friday and is working on a Pullback Opportunity (PBO) pattern, inside a Rounded Bottom Breakout (RBB) pattern.  The Reward/Risk is not ideal to the J-hook breakout point, but if we can make it to the top of the gap-down candle body (2/27) we could have a nice trade.

Trader Vision tells us to check the earnings date! The last date we show was 3/1/17, but I find no better date elsewhere.  TV20/20 tells us we have a nice set of conditions, but as planned, that first Target does not offer a great Reward/Risk. However, if AKRX can reach the 2nd or 3rd Targets, this could be a nice trade in an otherwise terrible day for setups.

Below is my markup of the chart and the trade plan as laid out by Trader Vision 20/20.  As a bonus, if you click the green button below, you’ll be able to watch a video of the chart markup and trade planning process.


The AKRX Trade Setup – As of 7-27-18

AKRX as of 7-27-18


The Trade Plan

AKRX Trade Plan for 7-30-18


Note how Trader Vision 20/20 does so much of the work for you.  Knowing the ratio of Bullish Conditions to Bearish ones as well as the overall risk of the position size, risk to Stop out and the Reward possible at each Target price can help a great deal with controlling our emotions.  Knowing the dollar impact of every scenario ahead of time, allows us to make calm decisions during the trade.  It really takes the pressure off.  No guesswork.  No surprises.  No emotional roller coaster.

To see a short video of this trade’s chart markup and trade planning, click the button below.


[button_2 color=”light-green” align=”center” href=”https://youtu.be/TQH8SD9EPmc” new_window=”Y”]Trade Plan Video[/button_2]


Put the power to Trader Vision 20/20 to work for you…

[button_2 color=”orange” align=”center” href=”https://hitandruncandlesticks.com/product/trader-vision-20-20-monthly-subscription2/” new_window=”Y”]TV20/20 Software[/button_2]


Testimonial

Trader Vision immediately simplified the process…immediately it provided that information and guidance to me. I knew what I would risk for how much reward, I began taking trades off at the 1st target, 2nd target, I was no longer holding all my trades for the homerun. I also began implementing the stop losses if and when they were reached, not just hoping the stock would recover.  It then became easier to see what patterns were working for me and which were not.  It provided a much more relaxed and stress-free environment. –Joan G


***************************************************************************************************

Investing and Trading involve significant financial risk and are not suitable for everyone. Ed Carter is not a licensed financial adviser nor does he offer trade recommendations or investment advice to anyone. No communication from Hit and Run Candlesticks Inc. is to be considered financial or trading advice. All information is intended for Educational Purposes Only. Terms of Service.

***************************************************************************************************

Defensive Stocks

Defensive Stocks

Defensive StocksConsumer defensive stocks have quietly risen out of bottom patterns over the last few weeks, and many of them showed a burst of bullish energy yesterday.  I’m beginning to wonder if we’re starting to see a quiet institutional rotation toward safety with so many of tech stocks priced at or near perfection levels.  Please understand I’m not making a prediction I’m only pointing out what I see in charts.

The current trends are still up, and the Bulls continue to hold onto control as the majority of earnings thus far have been positive.  Like I always do I will be ringing the register and taking some profits to lower my weekend and risk.  Next week is another huge week of earnings so rest up this weekend because we could be in for another wild ride next week.  Remember to take a look at those defensive stocks.

On the Calendar

We start the Friday Economic Calendar at 8:30 AM Eastern with the GDP report.  If consensus is correct, the President is going to get the reading on GDP that he wants with a four in front.  GDP expects a very strong 4.2 as the first estimate of the 2nd quarter with Consumer spending rising 2.9 percent.  Forecasters see Consumer Sentiment at 10:00 AM to come in unchanged with a solid reading of 97.1 in July.  The Baker-Huges Rig Count will close out this light calendar day at 1:00 PM.

On the Earnings Calendar, we have nearly 80 companies reporting with the vast majority of them coming in before the bell.  Some of the noteworthy are, XOM, PSX, CVX, WY, TWTR, CL & GT.

Action Plan

Overnight Asian markets finished the day mixed while Europian markets are rising across the board with the trade tensions now in the rearview mirror.  AMZN reported well last night but INTC another tech bellwether disappointed the market and is indicated sharply lower this morning.  Consequently, US Futures indicate a mixed open with Dow pointing higher and the Nasdaq flat to slightly lower.  Of course, that could easily change as we move toward the open due to a large number earnings reports before the bell.

Friday’s are more of a take profits focus rather than adding new risk ahead of the weekend.  Although it’s likely, I will stick to that pattern but never say never as there are always possible trades setting up.  So far the vast majority of earnings reports have been positive even with the disappointments from some of the so-called FANG stocks.  However, there still seems to be a bit of tentativeness in the overall market with so many stocks priced for perfection.  There was a noted improvement in consumer defensive stocks yesterday which may be a clue to an underlying rotation to safety.  I wish you all a fantastic weekend.

Trade Wisely,

Doug

[button_2 color=”green” align=”center” href=”https://youtu.be/EKY6zb1nCGw”]Morning Market Prep Video[/button_2]
OI Setup and Trade Plan

Today’s Featured Trade Idea is OI.

Members can also see his detailed review in the trading room at 9:10am Eastern.  For now, here is my analysis and a potential trade plan made using our Trader Vision 20/20 software.

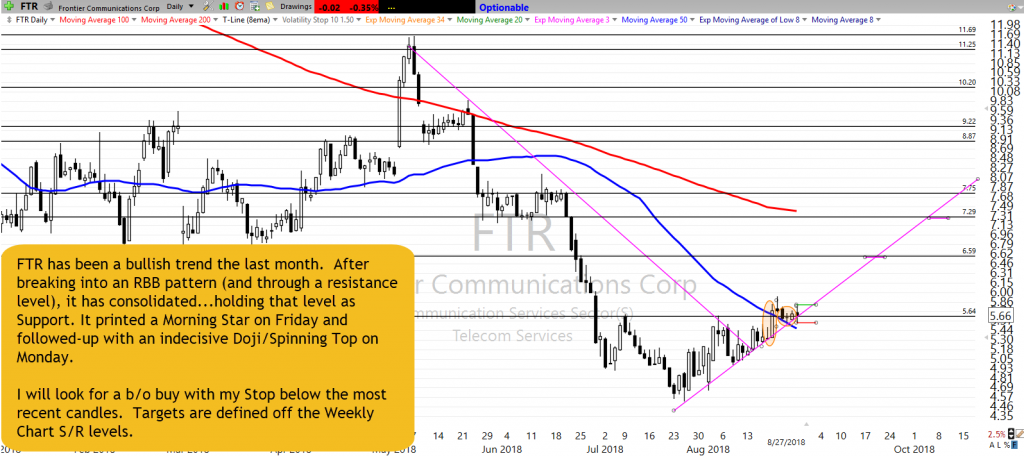
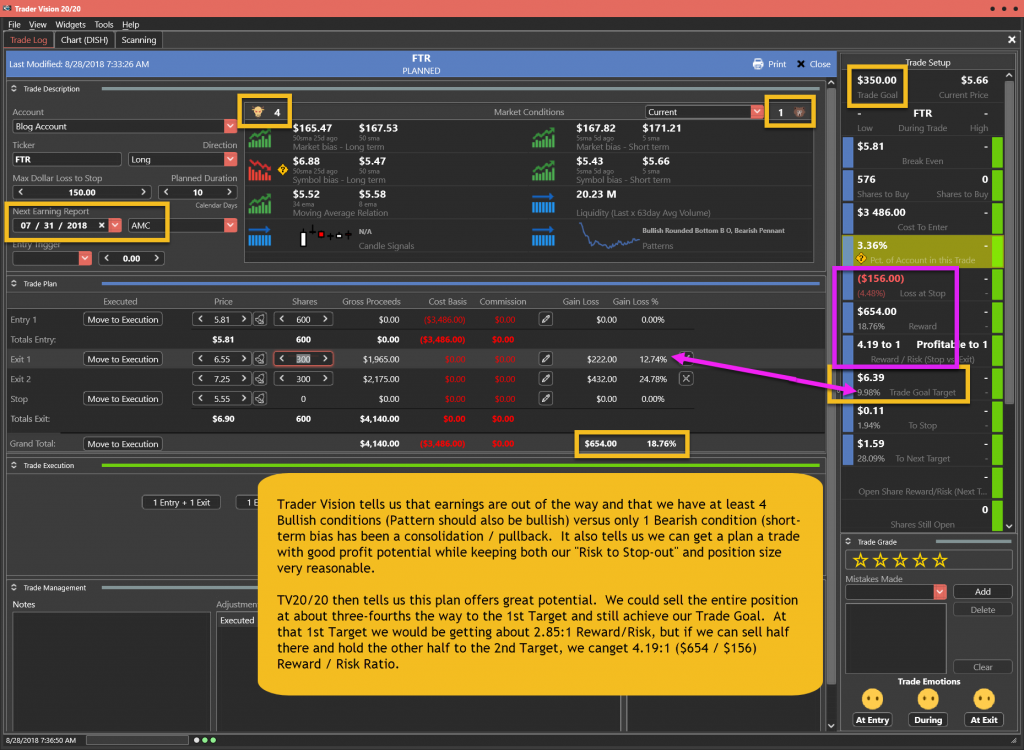
OI popped into a Rounded Bottom Breakout pattern on 7/24 (off earnings) and has consolidated with a little profit taking since. It has a Resistance level just overhead and the 50sma not too far below. I will be looking for a breakout Entry using the Thursday Candle Body Low as a Stop and next Resistance (off Weekly) as 1st Target. The Second Target price is another Resistance level as well as the 200sma.

Trader Vision shows us we have 3 months until earnings and 5 Bullish versus 1 Bearish condition. It also tells us that this plan would give us $145 Risk to Stop from the Entry and $383 (2.64:1 Reward/Risk) if we sold the entire position at the First Target. If we sold half there and held the rest until the Second Target we could make $465 (3.2:1) overall.

Below is my markup of the chart and the trade plan as laid out by Trader Vision 20/20.  As a bonus, if you click the green button below, you’ll be able to watch a video of the chart markup and trade planning process.


The OI Trade Setup – As of 7-26-18

OI chart as of 7-26-18


The Trade Plan

OI Trade Plan for 7-27-18


Note how Trader Vision 20/20 does so much of the work for you.  Knowing the ratio of Bullish Conditions to Bearish ones as well as the overall risk of the position size, risk to Stop out and the Reward possible at each Target price can help a great deal with controlling our emotions.  Knowing the dollar impact of every scenario ahead of time, allows us to make calm decisions during the trade.  It really takes the pressure off.  No guesswork.  No surprises.  No emotional roller coaster.

To see a short video of this trade’s chart markup and trade planning, click the button below.


[button_2 color=”light-green” align=”center” href=”https://youtu.be/ncWavUzy2Tk” new_window=”Y”]Trade Plan Video[/button_2]


Put the power to Trader Vision 20/20 to work for you…

[button_2 color=”orange” align=”center” href=”https://hitandruncandlesticks.com/product/trader-vision-20-20-monthly-subscription2/” new_window=”Y”]TV20/20 Software[/button_2]


Testimonial

Trader Vision immediately simplified the process…immediately it provided that information and guidance to me. I knew what I would risk for how much reward, I began taking trades off at the 1st target, 2nd target, I was no longer holding all my trades for the homerun. I also began implementing the stop losses if and when they were reached, not just hoping the stock would recover.  It then became easier to see what patterns were working for me and which were not.  It provided a much more relaxed and stress-free environment. –Joan G


***************************************************************************************************

Investing and Trading involve significant financial risk and are not suitable for everyone. Ed Carter is not a licensed financial adviser nor does he offer trade recommendations or investment advice to anyone. No communication from Hit and Run Candlesticks Inc. is to be considered financial or trading advice. All information is intended for Educational Purposes Only. Terms of Service.

***************************************************************************************************