Breakout Test Follow-through Profit Member E-Learning Tonight

Breakout Test Follow-through Profit

Finding and Trading The T-Line Bounce

Swing Trader

Breakout Test Follow-through Profit, how easy is that? Well not always so easy as some have found. When looking at a chart, you must have several conditions before you have a reason, (reason to pull the trigger). Let’s look AMD, Trending, recent breakout, Bull Kicker, PBO to the T-Line, Bullish Engulf buy pattern on the T-Line, J-Hook continuation pattern. So how many conditions did we list? Can you see more? Do we have enough to have a reason to buy? We are currently long AMD and will consider adding over $19.35

For more details on the AMD trade, please click the following link. Get the complete details including Fibonacci details TV2020 trade plan right here

Monthly Trading Results Right Here  Each, and every day we not only share trade ideas we also share how we plan to trade them.

Subscription PlansPrivate 2-Hour Coaching

What is Rick is adding to his trade watchlist today? A 246% plus increase in 7 months can’t

be all wrong.  Right Here

Past performance is not indicative of future returns

Good Trading, Rick, and Trading Team

____________________________________________________________

SPY • Bullish Engulf 2 Bar Follow through

For days ago the SPY printed a Bullish Engulf, and with the help of the $279.30 support line, the buyers have hung around to party. It looks as if the SPY and the buyers are on a mission to challenge their old friends at the January 26th party. The trend is still rising, price leading the T-Line, Life is good.

****VXX – The VXX chart is below the T-Line, no fear, no worries.

Focus Trading Education

Candlesticks • Price Action • T-Line • T-Line Bands • Support • Resistance • Trend • Trendlines • Chart Patterns • Buy Box • Volatility Stops • Profit Zones • Entry Zones • Protective Stops • RBB Rounded Bottom Breakout Strategy • Pop Out of The Box Strategy • Pinball Strategy • Trade Planning, Fibonacci, Stoch/RSI

To learn more about our trading tools join us in the trading room or consider Private Coaching.

Testimonial

This is not your usual service that sends out a ton of stock recommendations, and then cherry picks the winners to show you how great they are. Hit and Run Candlesticks and Right Way Options are truly educational services. They taught me how to trade not what to trade. The entire team: Rick, Doug, Steve, and Ed are there to help and answer your questions. They are awesome. They cut years off my learning curve. And it’s a team effort. Everyone in the room (all the members) are there to help with invaluable insights and advice. The only service you will ever need. Thanks to all the team for how you have helped me and for all you do. –Jonathan Bolnick

Rare to have a service teach you how they find their choices but, HRC/RWO teach you how to fish instead of fishing for you. And, your ideas are not panned but shared, implemented, or improved. Sharing is caring. –Thomas Bradly


Past performance is not indicative of future returns

Investing and Trading involve significant financial risk and is not suitable for everyone. No communication from Hit and Run Candlesticks Inc, Right Way Option, Trader Vision 2020 or Rick Saddler, Doug Campbell, Ed Carter, Steve Risner is to be considered financial or trading advice. All information is intended for Educational Purposes Only. Terms of Service.

Rick Saddler, Doug Campbell, Ed Carter, Steve Risner is not a licensed financial adviser nor do they offer trade recommendations or advice to anyone.


AMD Setup and Trade Plan

Today’s Featured Trade Idea is AMD.

You can read more about this trade in Rick’s blog post here.  Members can also see his detailed review in the trading room at 9:10am Eastern.  For now, here is my analysis and a potential trade plan made using our Trader Vision 20/20 software.

AMD shows a beautiful long-term trend and is working on a Pullback Opportunity now. We have to go out to a 7-day chart to find Resistance above and that lines up nicely with a Fib Extension of the most recent Bull run.

I will be looking for a positive trading Entry with Stop below Monday’s candle body. I’ll use the convergence areas as Targets and can play with scenarios of whether I trade it as 1, 2 or 3 Targets. We have this luxury since we have well over 2.5mo until earnings.

Trader Vision shows us Earnings are out of the way and that there are many Bullish conditions in favor of this trade. It also shows that we are able to make our Trade Goal, even if we have to sell the entire position at Target #1.

However, then TV20/20 makes it easy for us to do scenario planning to decide between using 2 or 3 Targets. It tells us what each Target would deliver in profit, as well as do to the trade overall in terms of Reward/Risk.

Having these this knowledge before a trade is even entered makes it much easier to control emotions and maintain discipline.

Below is my markup of the chart and the trade plan as laid out by Trader Vision 20/20.  As a bonus, if you click the green button below, you’ll be able to watch a video of the chart markup and trade planning process.


The AMD Trade Setup – As of 8-6-18

AMD as of 8-6-18

The Trade Plan

AMD Trade Plan for 8-7-18

Note how Trader Vision 20/20 does so much of the work for you.  Knowing the ratio of Bullish Conditions to Bearish ones as well as the overall risk of the position size, risk to Stop out and the Reward possible at each Target price can help a great deal with controlling our emotions.  Knowing the dollar impact of every scenario ahead of time, allows us to make calm decisions during the trade.  It really takes the pressure off.  No guesswork.  No surprises.  No emotional roller coaster.

To see a short video of this trade’s chart markup and trade planning, click the button below.


[button_2 color=”light-green” align=”center” href=”https://youtu.be/Jm1UH2l6RMY” new_window=”Y”]Trade Plan Video[/button_2]


Put the power to Trader Vision 20/20 to work for you…

[button_2 color=”orange” align=”center” href=”https://hitandruncandlesticks.com/product/trader-vision-20-20-monthly-subscription2/” new_window=”Y”]TV20/20 Software[/button_2]


Testimonial

Trader Vision immediately simplified the process…immediately it provided that information and guidance to me. I knew what I would risk for how much reward, I began taking trades off at the 1st target, 2nd target, I was no longer holding all my trades for the homerun. I also began implementing the stop losses if and when they were reached, not just hoping the stock would recover.  It then became easier to see what patterns were working for me and which were not.  It provided a much more relaxed and stress-free environment. –Joan G


***************************************************************************************************

Investing and Trading involve significant financial risk and are not suitable for everyone. Ed Carter is not a licensed financial adviser nor does he offer trade recommendations or investment advice to anyone. No communication from Hit and Run Candlesticks Inc. is to be considered financial or trading advice. All information is intended for Educational Purposes Only. Terms of Service.

***************************************************************************************************

Five Bars OF Bullish Consolidation On Support

Five Bars OF Bullish Consolidation On Support

Finding and Trading The T-Line BounceFive bars of bullish consolidation on support after a trend reversal on the April gap. The trend has continued to post higher lows and higher highs while remaining above the bullish trend line. The July candle gapped and slid back holding support; the next four candles also held support. Thursday’s candle engulfed that past two candles, and Friday closed near the high presenting a Bullish Doji continuation pattern. We will consider a buy above $24.00.

For more details on the FDC trade, please click the following link. Get the complete details including Fibonacci details TV2020 trade plan right here

Past performance is not indicative of future returns

Good Trading, Rick, and Trading Team

Monthly Trading Results Right Here  Each, and every day we not only share trade ideas we also share how we plan to trade them.

Subscription PlansPrivate 2-Hour Coaching

What is Rick is adding to his trade watchlist today? A 246% plus increase in 7 months can’t be all wrong.  Right Here

____________________________________________________________

SPY • All-Time High Around the Corner

The chart pattern of the SPY suggests a challenge of the July 25th candle, a close above the July 25th candle could push the Bullish J-Hook continuation pattern into a little run that could challenge the January 2018 highs. Monday morning premarket and Fridays close looks as if the bulls will start the day. Follow price action and listen to what the market is saying. Good trading

****VXX – The VXX chart is back below the T-Line, no fear

Focus Trading Education

Candlesticks • Price Action • T-Line • T-Line Bands • Support • Resistance • Trend • Trendlines • Chart Patterns • Buy Box • Volatility Stops • Profit Zones • Entry Zones • Protective Stops • RBB Rounded Bottom Breakout Strategy • Pop Out of The Box Strategy • Pinball Strategy • Trade Planning, Fibonacci, Stoch/RSI

To learn more about our trading tools join us in the trading room or consider Private Coaching.

Testimonial

This is not your usual service that sends out a ton of stock recommendations, and then cherry picks the winners to show you how great they are. Hit and Run Candlesticks and Right Way Options are truly educational services. They taught me how to trade not what to trade. The entire team: Rick, Doug, Steve, and Ed are there to help and answer your questions. They are awesome. They cut years off my learning curve. And it’s a team effort. Everyone in the room (all the members) are there to help with invaluable insights and advice. The only service you will ever need. Thanks to all the team for how you have helped me and for all you do. –Jonathan Bolnick

Rare to have a service teach you how they find their choices but, HRC/RWO teach you how to fish instead of fishing for you. And, your ideas are not panned but shared, implemented, or improved. Sharing is caring. –Thomas Bradly


Past performance is not indicative of future returns

Investing and Trading involve significant financial risk and is not suitable for everyone. No communication from Hit and Run Candlesticks Inc, Right Way Option, Trader Vision 2020 or Rick Saddler, Doug Campbell, Ed Carter, Steve Risner is to be considered financial or trading advice. All information is intended for Educational Purposes Only. Terms of Service.

Rick Saddler, Doug Campbell, Ed Carter, Steve Risner is not a licensed financial adviser nor do they offer trade recommendations or advice to anyone.


Long-Term Success

Long-Term Success

Long-Term SuccessHaving the discipline to follow a good set of rules is essential to achieving long-term success as a trader.  A rule that has served me very well over the years is to avoid buying stocks at or near price resistance.  That rule directly translates to the overall market as well.  When the indexes are at or near price resistance levels as they are today, it’s very important to exercise some caution.  As we push toward market highs, traders often over-trade loading up on positions very near where failure patterns appear.

Please don’t misunderstand I am not predicting a failure.  I, in fact, want to see the market move higher!  However, a bullish desire must not cloud your view of other possibilities.  As the market approaches resistance, I want to be very focused on price action watching for both bullish and bearish clues.  I want to evaluate my current holdings carefully and weigh the consequences of adding additional risk as an index nears a resistance level.  Remember good trade management starts well before the position becomes part of your portfolio.

On the Calendar

A light day to begin this Monday on Economic Calendar with no market-moving reports expected.  We have three Bond Events between 11:00 & 11:30 AM, the TD Ameritrade IMX @ 12:30 AM and Treasury STRIPS @ 3:00 PM to close the calendar day.

A very big week of earnings reports begins with more than 200 companies results today.  Continue to prepare each day by checking earnings reporting dates against the stocks you own or are considering for purchase.

Action Plan

We closed last week with bulls pushing upward to test price resistance levels of the prior week.  Unfortunately, they were unable to breakthrough giving us a reason to watch price action closely and approach this morning with a bit of caution.  Asian markets were mixed but mostly lower while European markets are choosing to move higher.  Currently, the Dow Futures are pointing to a modestly higher open with a busy Earnings Calander that could easily move it around before the open.

By in large earnings reports continue to roll in mostly positive, but the slide in the FB and NFLX continues to weigh heavily on the mind of the market and dampening enthusiasm.  Last week the bulls proved the ability to defend against the political uncertainty of a US/China trade war.  Now the question is do they have the energy to reclaim price resistance levels and hold them as support.  As we test resistance, be careful not to overtrade and stay focused on price action clues.

Tade Wisely,

Doug

[button_2 color=”green” align=”center” href=”https://youtu.be/F9zaMntRExc”]Morning Market Prep Video[/button_2]
FDC Setup and Trade Plan

Today’s Featured Trade Idea is FDC.

You can read more about this trade in Rick’s blog post here.  Members can also see his detailed review in the trading room at 9:10am Eastern.  For now, here is my analysis and a potential trade plan made using our Trader Vision 20/20 software.

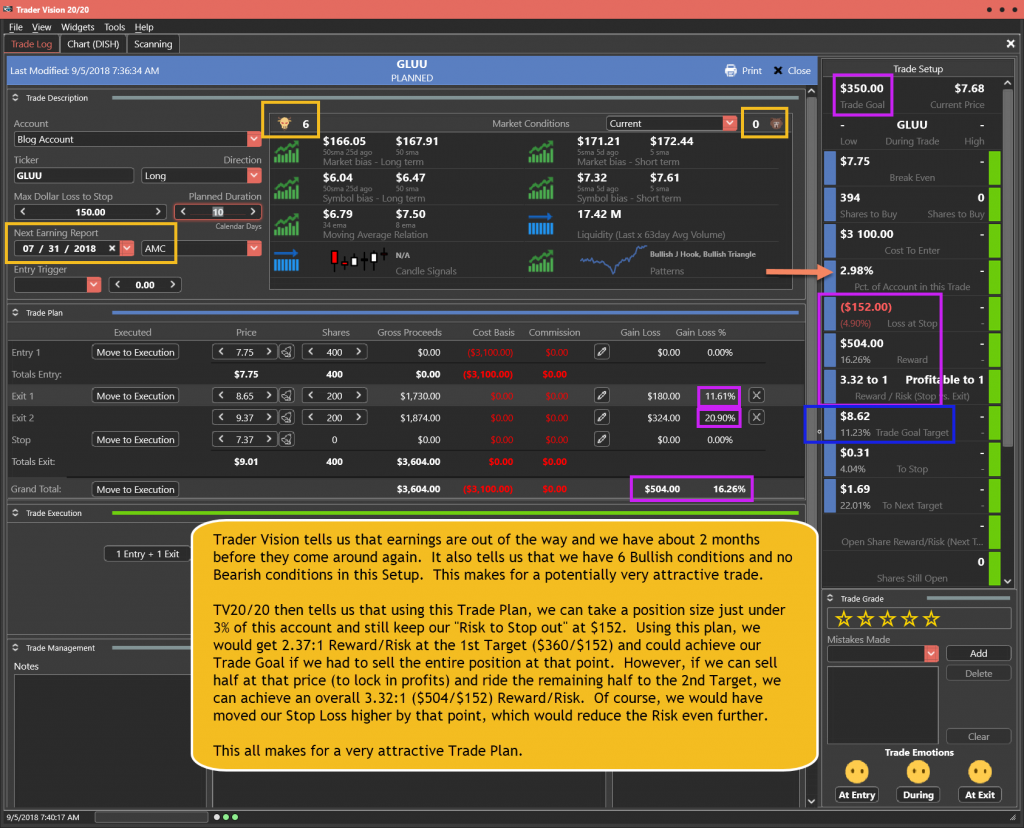
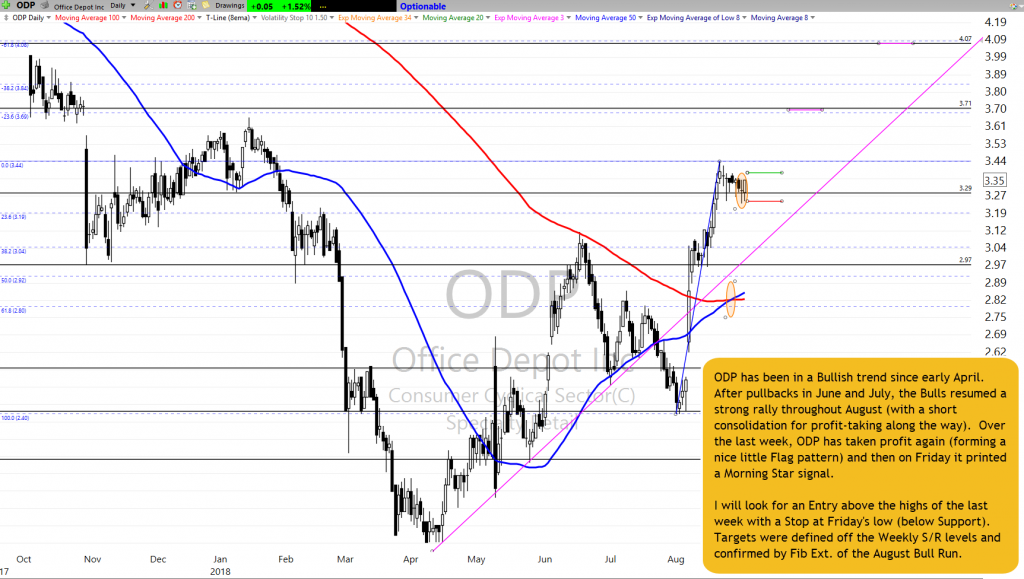
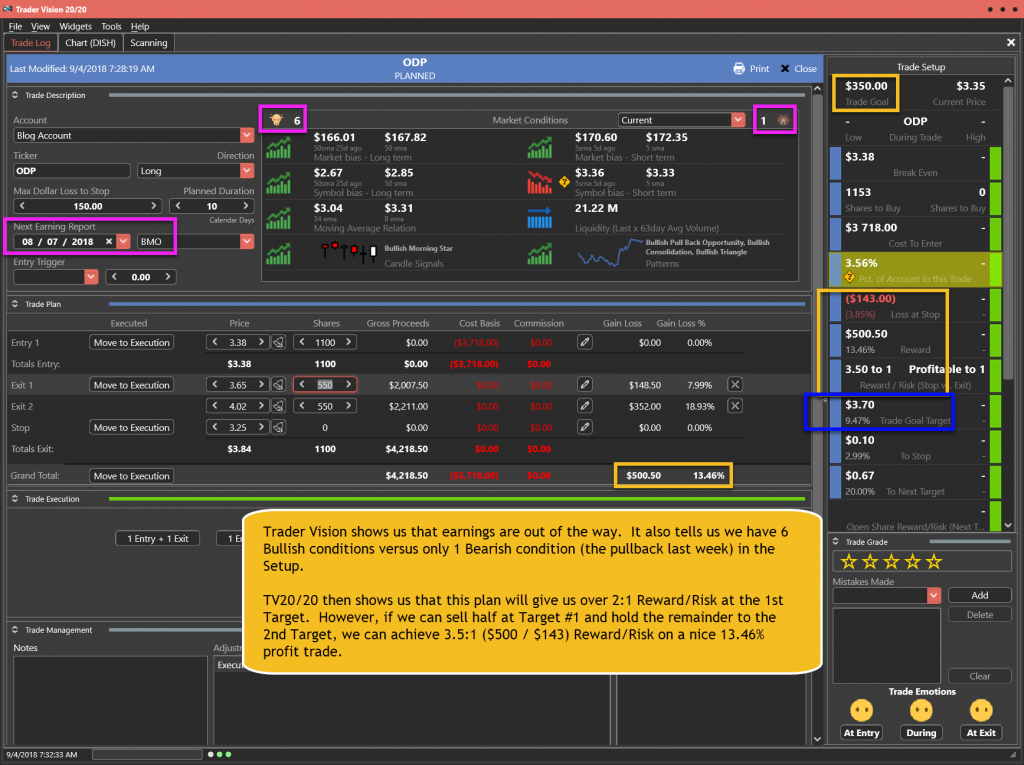
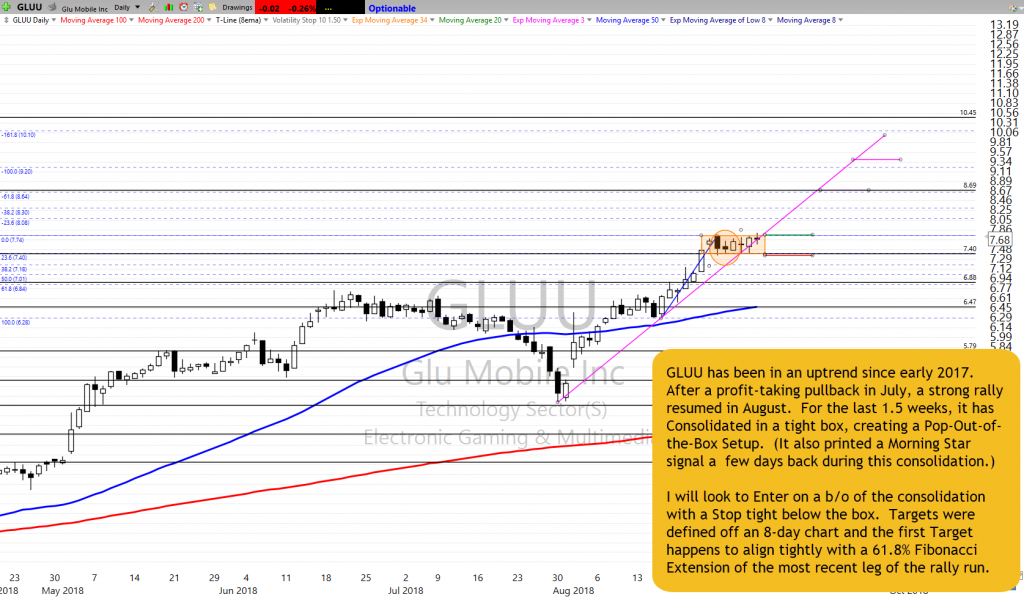
FDC printed a Bullish Engulfing signal Thursday and then a Doji (or Hanging Man) type candle at the breakout level of a small J-hook pattern on Friday.  I will be looking for a b/o above $24 for Entry using the 23.6% Fib retracement of the pre-hook run as my Stop.  I’ll use Fib Extension Targets here at all-time highs (and use 3 Targets since we have 3mo. until the next Earnings…I don’t expect to be in anywhere near that long, but I have time on this ticker).

Trader Vision tells us we have 3 months (essentially) until the next earnings and have 5 Bullish conditions versus 2 Bearish conditions. TV20/20 tells us this Trade Plan can achieve our Trade Goal between the 1st and 2nd Target prices…and that overall it would provide an 11.18% profit.

Below is my markup of the chart and the trade plan as laid out by Trader Vision 20/20.  As a bonus, if you click the green button below, you’ll be able to watch a video of the chart markup and trade planning process.


The FDC Trade Setup – As of 8-3-18

FDC as of 8-3-18

The Trade Plan

FDC Trade Plan for 8-6-18

Note how Trader Vision 20/20 does so much of the work for you.  Knowing the ratio of Bullish Conditions to Bearish ones as well as the overall risk of the position size, risk to Stop out and the Reward possible at each Target price can help a great deal with controlling our emotions.  Knowing the dollar impact of every scenario ahead of time, allows us to make calm decisions during the trade.  It really takes the pressure off.  No guesswork.  No surprises.  No emotional roller coaster.

To see a short video of this trade’s chart markup and trade planning, click the button below.


[button_2 color=”light-green” align=”center” href=”https://youtu.be/I9t21RNN7Wk” new_window=”Y”]Trade Plan Video[/button_2]


Put the power to Trader Vision 20/20 to work for you…

[button_2 color=”orange” align=”center” href=”https://hitandruncandlesticks.com/product/trader-vision-20-20-monthly-subscription2/” new_window=”Y”]TV20/20 Software[/button_2]


Testimonial

Trader Vision immediately simplified the process…immediately it provided that information and guidance to me. I knew what I would risk for how much reward, I began taking trades off at the 1st target, 2nd target, I was no longer holding all my trades for the homerun. I also began implementing the stop losses if and when they were reached, not just hoping the stock would recover.  It then became easier to see what patterns were working for me and which were not.  It provided a much more relaxed and stress-free environment. –Joan G


***************************************************************************************************

Investing and Trading involve significant financial risk and are not suitable for everyone. Ed Carter is not a licensed financial adviser nor does he offer trade recommendations or investment advice to anyone. No communication from Hit and Run Candlesticks Inc. is to be considered financial or trading advice. All information is intended for Educational Purposes Only. Terms of Service.

***************************************************************************************************

GT Setup and Trade Plan

Today’s Featured Trade Idea is GT…and I also demonstrate the new Trader Vision Scanning Widget in today’s video.

You can read more about this trade in Rick’s blog post here.  Members can also see his detailed review in the trading room at 9:10am Eastern.  For now, here is my analysis and a potential trade plan made using our Trader Vision 20/20 software.

GT made a strong rally on earnings a few days ago, breaking into an RBB pattern. It has then consolidated at Resistance for 3 days and printed a Hammer Wed. and a Bull Engulfing signal on Thur.  I will be looking for a b/o of Resistance as my Entry, using the line across the recent lows as Supportive protection for my Stop. The 2 Targets are the obvious Resistance levels above between here and the 200sma.

Trader Vision tells us that we have earnings out of the way for the next 3mo. It also shows us that this plan gives us 2.77:1 ($270/$98) Reward/Risk to the first Target and 4.12:1 ($401/$98) if both Targets are reached. If this ticker reaches $26.73, we could close the entire trade and make our Goal for the Trade.

Below is my markup of the chart and the trade plan as laid out by Trader Vision 20/20.  As a bonus, if you click the green button below, you’ll be able to watch a video of the chart markup and trade planning process.

The TV20/20 New Scanning Widget

The GT Trade Setup – As of 8-2-18

GT Setup as of 8-2-18

The Trade Plan

GT Trade Plan for 8-3-18

Note how Trader Vision 20/20 does so much of the work for you.  Knowing the ratio of Bullish Conditions to Bearish ones as well as the overall risk of the position size, risk to Stop out and the Reward possible at each Target price can help a great deal with controlling our emotions.  Knowing the dollar impact of every scenario ahead of time, allows us to make calm decisions during the trade.  It really takes the pressure off.  No guesswork.  No surprises.  No emotional roller coaster.

To see a short video of this trade’s chart markup and trade planning, click the button below.


[button_2 color=”light-green” align=”center” href=”https://youtu.be/YpFteuPF7Tw” new_window=”Y”]Trade Plan Video[/button_2]


Put the power to Trader Vision 20/20 to work for you…

[button_2 color=”orange” align=”center” href=”https://hitandruncandlesticks.com/product/trader-vision-20-20-monthly-subscription2/” new_window=”Y”]TV20/20 Software[/button_2]


Testimonial

Trader Vision immediately simplified the process…immediately it provided that information and guidance to me. I knew what I would risk for how much reward, I began taking trades off at the 1st target, 2nd target, I was no longer holding all my trades for the homerun. I also began implementing the stop losses if and when they were reached, not just hoping the stock would recover.  It then became easier to see what patterns were working for me and which were not.  It provided a much more relaxed and stress-free environment. –Joan G


***************************************************************************************************

Investing and Trading involve significant financial risk and are not suitable for everyone. Ed Carter is not a licensed financial adviser nor does he offer trade recommendations or investment advice to anyone. No communication from Hit and Run Candlesticks Inc. is to be considered financial or trading advice. All information is intended for Educational Purposes Only. Terms of Service.

***************************************************************************************************

Whipsaw rally

Whipsaw rally

Whipsaw rallyA big morning gap down followed by a sharp whipsaw rally closed the day with the indexes testing resistance levels.  It was nice to see the Bulls defend, but the question remains if they have the energy to reclaim this week’s highs.  With trade war rhetoric flying around ahead of the weekend we will have to stay focused on price action and remain flexible.

With so much uncertainty and choppy price action, it’s very easy to get caught up in the drama and find yourself over-trading.  This is the kind of market that can chop a traders account to pieces if you’re not careful and very disciplined to a set of rules.  If you see your accounts grow, then congratulations and keep up the good work.  However, if you see your accounts in decline, then it’s time to stop, and regroup.  Remember doing the same thing over and over and expecting a  different result is the definition of insanity.

On the Calendar

The Friday Economic Calendar gets going with two market-moving reports before the bell at 8:30 AM Eastern.  First, the Employment Situation report which is expected to remain very strong with an increase of 190,000 new jobs.  Consensus says the unemployment rate is 3.9 percent in July with a 0.3 percent gain in hourly earnings with average hours worked at 34.4.  Second, the International Trade report expects the trade deficit in goods to widen slightly to 45.6 billion vs. the May reading of 43.1 billion.  Then at 10:00 AM the ISM Non-Mfg. Index according to consensus will decline to 58.8 but continues to show exceptional strength.  We a PMI Services Index report @ 9:45 and the Baker-Hughes Rig Count @ 1:00 PM to close out a very busy calendar week.

On the Earnings Calendar, the earnings reports slow down with just under 100 companies fessing up to their results.  We have more than 1300 companies reporting next week so keep us on our toes.

Action Plan

After a substantial morning gap down the Bulls charged attempting to shake off trade war jitters and keeping traders off balance with the ship price action.  As good as it was to see the Bulls defend, please keep in mind yesterdays rally let the indexes ver near resistance levels.  Asian markets were mixed last night with European markets all slightly higher.  Currently, the Dow Futures suggest a flat to slightly bullish open but keep in mind that could quickly change with a couple big market-moving Economic reports before the bell.

The choppy price action has been challenging, and that could continue with another big round of earnings next week.  A,s you know, I like to reduce my weekend risk by taking some profits and avoiding adding new trades on Friday.  However, you never say never and with so many reports now in the rearview mirror there are good opportunities as long as we can stay out of a trade war with China.

Trade Wisely,

Doug

[button_2 color=”green” align=”center” href=”https://youtu.be/1LG-3tOl-5c”]Morning Market Prep Video[/button_2]