WETF Bullish (RBB) Rounded Bottom Breakout WETF Bullish Above $8.50, Stop Near $8.22

WETF Bullish (RBB) Rounded Bottom Breakout

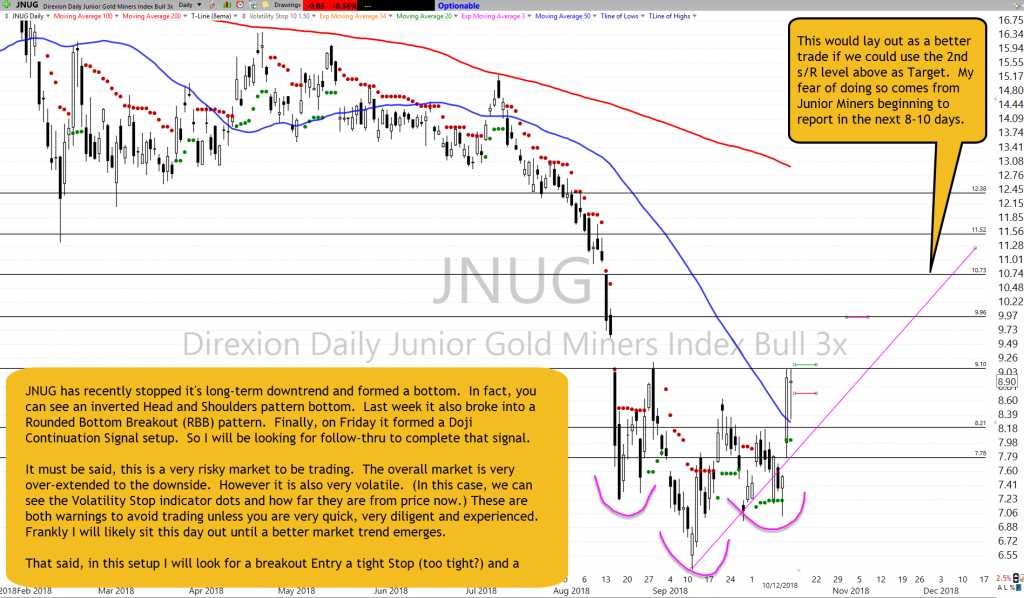
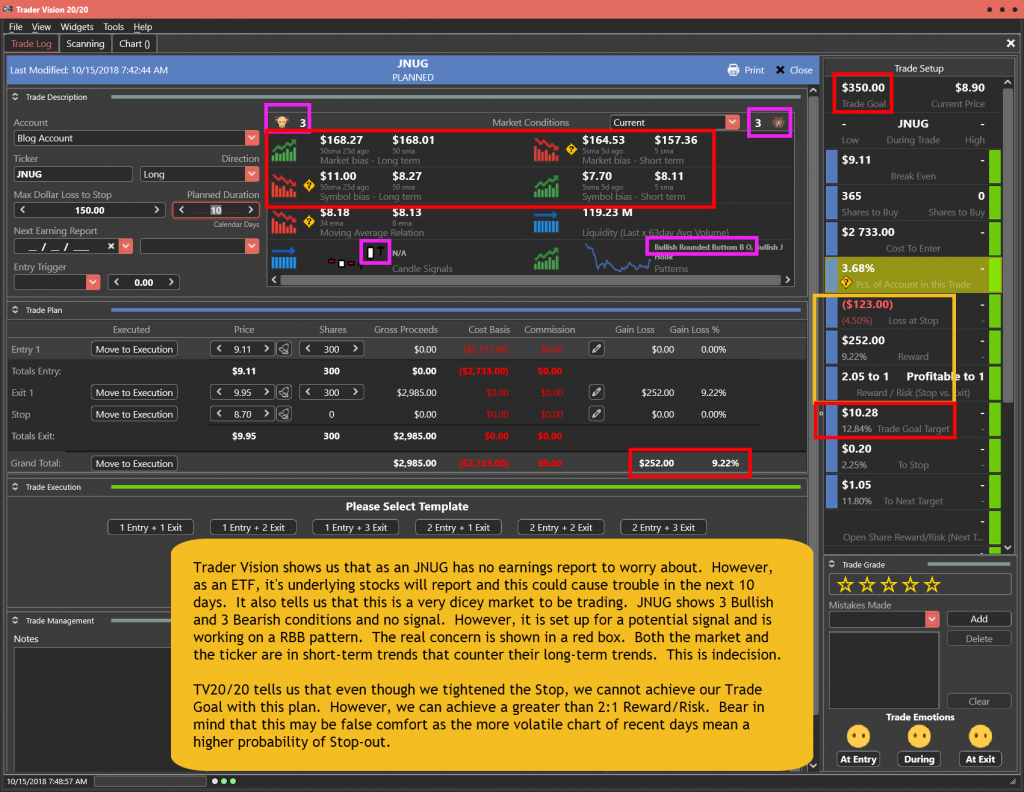
WETF became a bullish (RBB) Rounded Bottom Breakout a few days ago after a breakout of the Inverted Head and Shoulder bottom and a couple of Morning Star Signals. WETF bullish above $8.50, Stop Near $8.22. Price action broke out of the Upper T-Line Reg Line and tested with another bullish Morning Star Signal. The WETF chart has about 18% to the RBB top, with a few good minor profit zones in between.

[images style=”0″ image=”http%3A%2F%2Fhitandruncandlesticks.com%2Fwp-content%2Fuploads%2F2018%2F10%2FRBB10-1-1.png” width=”665″ link_url=”https%3A%2F%2Fob124-10cd91.pages.infusionsoft.net%2F” new_window=”Y” align=”center” top_margin=”0″ full_width=”Y”]


 “Shed the FOMO attitude before coming to work.”

Past performance is not indicative of future returns

Good Trading, Rick, and Trading Team

____________________________________________________________

SPY • NAFTA Pop

Looks the bulls will pop the market upon NAFTA news today. Dancing in the street, Jubilation let’s throw some breeds. Remember to follow our rules; gaps are gifts, never chase, and take some profits into strength. I look like the upper T-Line Reg line will be tested on the DIA’s and the SPY, QQQ’s are already above, and the IWM is still too far away. Today’s closing candle will be an important clue on how the market sees the week and the days ahead. A stong candle close would suggest the gap is real; a weak close would suggest the pop was a new excitement pop with a fizzle. Let’s follow the clues.

****VXX – Will be gapping down today due to the bullishness in the market.

Focus Trading Education

Candlesticks • Price Action • T-Line • T-Line Bands • Support • Resistance • Trend • Trendlines • Chart Patterns • Buy Box • Volatility Stops • Profit Zones • Entry Zones • Protective Stops • RBB Rounded Bottom Breakout Strategy • Pop Out of The Box Strategy • Pinball Strategy • Trade Planning, Fibonacci, Stoch/RSI

Subscription PlansPrivate 2-Hour Coaching

Testimonial

This is not your usual service that sends out a ton of stock recommendations, and then cherry picks the winners to show you how great they are. Hit and Run Candlesticks and Right Way Options are truly educational services. They taught me how to trade not what to trade. The entire team: Rick, Doug, Steve, and Ed are there to help and answer your questions. They are awesome. They cut years off my learning curve. And it’s a team effort. Everyone in the room (all the members) are there to help with invaluable insights and advice. The only service you will ever need. Thanks to all the team for how you have helped me and for all you do. –Jonathan Bolnick

Rare to have a service teach you how they find their choices but, HRC/RWO teach you how to fish instead of fishing for you. And, your ideas are not panned but shared, implemented, or improved. Sharing is caring. –Thomas Bradly


Past performance is not indicative of future returns

Investing and Trading involve significant financial risk and is not suitable for everyone. No communication from Hit and Run Candlesticks Inc, Right Way Option, Trader Vision 2020, Top Gun Futures or Rick Saddler, Doug Campbell, Ed Carter, Steve Risner is to be considered financial or trading advice. All information is intended for Educational Purposes Only. Terms of Service.

Rick Saddler, Doug Campbell, Ed Carter, Steve Risner is not a licensed financial adviser nor do they offer trade recommendations or advice to anyone.


New Trade Agreement

New Trade Agreement

New Trade AgreementA huge bullish gap to begin the first day of trading of the 4th quarter after inking a new trade agreement between the US and Canada fired up the futures last night.  Asian markets closed up across the board, and European markets are currently showing green across the board.  As I write this, US Futures suggest a huge morning gap 200 points.

If you’re holding long positions, remember gaps are gifts!  As a result, I will be looking to scale out or even close some positions taking that gift to the bank.  Remember big news driven gaps create a lot of emotion and the Fear of Missing Out is very powerful causing many traders to leap before looking.  Whipsaws are common at or near market highs so be careful not to get caught up in the morning hype blindly chasing in at the open.  Is it possible the open is the highest print of the day? Yes, it’s possible, so stay focused on price action and avoid chasing.

On the Calendar

We begin the first day of the new quarter with a Fed Speaker at 8:30 AM Eastern on the Economic Calendar.  At 9:45 AM the PMI Mfg. Index expects a reading of 54.5 vs. September’s 55.6 flash number according to consensus.  The ISM MFG at 10:00 AM is the most likely market-moving report of the day and expects a small decline to  59.9 vs. the very strong 61.3 August reading.  Also at 10:00 AM, Construction Spending according to consensus will see in increase of 0.5 percent vs. July’s marginal 0.1 gain.  We have a Fed Speaker at 11:00 AM and a Bond Announcement, two Bond Auctions at 11:30 AM, with yet another Fed Speaker to wrap up the calendar day at 12:15 PM.

On the Earnings Calendar, we have 15 companies expected to report today with the most notable being SFIX after the bell.

Action Plan

A new trade agreement between the US and Canada was reached just before reaching the Presidents deadline has really fired up the Bulls this morning.  Currently, the Dow would gap 200 points higher on the news with all the other indexes surging higher as well.  Those holding short positions like my long VXX Calls will experience pain this morning caught in this Bullish trap.

However, be careful not to get caught up in the morning hype and remember a big gap up at or near market highs can experience nasty whipsaw price action.  Wait for proof after the open that real buyers are stepping in support of the gap before jumping into the fray.  Long positions could see a nice surge in profits this morning.  Gaps are gifts, and I will most likely close part or all of some trades to unwrap those gifts and bank the gains.

Trade Wisely,

Doug

[button_2 color=”green” align=”center” href=”https://youtu.be/dj0gQqhznBQ”]Morning Market Prep Video[/button_2]

More Questions than Answers!

More Questions than Answers!

More Questions than Answers!The light volume choppy rally yesterday was ultimately unable to hold onto gains by the end of the day leaving more questions than answers.  There were noticeably fewer companies moving up supporting the rally.  There is nothing in the charts that’s particularly bearish, but I do think there is a reason to be a little cautious as we head into the weekend.

It’s not surprising that the Futures are suggesting a lower open this morning but keep in mind this is the last trading day of the quarter, and some intentional window dressing is not out of the question.  However, if by chance the bears have the strength to follow through with some downside pressure we could see some quick selling if trends and support levels begin to fail.  Set aside your bias focus on price action.  Remember anything can happen over the weekend so plan the carefully the risk you carry into the weekend.

On the Calendar

Friday has three potential market-moving reports on the Economic Calendar.  At 8:30 AM Eastern Personal Income and Outlays expect to show a personal income increase of 0.4 percent in August while personal spending rose just 0.3 percent.  Then at 9:45 AM the Chicago PMI is expected to indicate steady strength with a consensus of 62.3 reading in August.  The Consumer Sentiment consensus at 10:00 AM to remain very strong with an expectation of a 110.8 reading in September.  We have the Baker-Hughes Rig Count @ 1:00 PM and a Fed speaker after the bell at 4:45 PM to end the 3rd quarter calendar.

On the Earnings Calendar, we have 15 companies reporting today.  MTN, reporting before the bell is the most notable report today.

Action Plan

After what seemed to be a relentless light volume push higher during the day the bulls found themselves unable to hold the advance into the close.  The indexes left behind less than confident candle pattern on the DIA, and SPY while the IWM largely rested.  The QQQ was the only index suggesting much bullishness at the end of the day holding on to the majority of the days gain by the close.  Asian markets ended the week on a high note closing higher across the board, but European markets are just the opposite seeing red across the board.

Consequently, it’s on a big surprise to see the US Futures pointing to a lower open this morning.  With this being the last trading day of the 3rd quarter don’t rule out the possibility of window dressing allowing the big funds the ability to wrap up the quarter strong.  However, if the bears are able to mount a sustained attack, keep an eye on trends and support levels.  If they hold as support, we can go into the weekend without much worry, but if levels begin to fail, we could see some quick selling to reduce weekend risk.  Have a wonderful weekend everyone!

Trade Wisely,

Doug

[button_2 color=”green” align=”center” href=”https://youtu.be/WFKC36i9_Xk”]Morning Market Prep Video[/button_2]

T-Line Regression Lines Introduced Rounded Bottom Breakout Workshop

T-Line Regression Lines Introduced

This week I introduced the T-Line Regression Lines to Hit and Run Candlestick members. You can pick up recording on Youtube on how to set them up on TC2000. Don’t forget to subscribe and click the subscribing bell.

It’s Friday and another great week of trading is about over. The SPY weekly chart (closing Thursday) has painted a Doji above the T-Line, and the T-Line is in a bullish trend. This weeks Doji close is slightly lower than the previous candle close suggesting the bulls have been under a little pressure. The market had to endure the FOMC announcement this week and trade is still haunting the market.

The SPY, Di’s and QQQ’s are trending well with the T-Line bull, and the QQQ’s are painting a Bullish Engulf. IWM is not doing so well with a price below the T-Line and testing the T-Regression Line Low.

My big winner this week was PZZA with a 135% Call Option profit. PZZA is an RBB setup, a huge favorite of mine. On October 17, I will be presenting a workshop on the RBB setup. To learn more about it click here

[images style=”0″ image=”http%3A%2F%2Fhitandruncandlesticks.com%2Fwp-content%2Fuploads%2F2018%2F09%2FRBB-workshop-1.png” width=”666″ link_url=”https%3A%2F%2Fob124-10cd91.pages.infusionsoft.net%2F” new_window=”Y” align=”center” top_margin=”0″ full_width=”Y”]

Membership ServicesPrivate 2-Hour Coaching


Past Performance Is No Guarantee of Future Results

Investing and Trading involve significant financial risk and is not suitable for everyone. No communication from Hit and Run Candlesticks Inc, Right Way Option, Trader Vision 2020 or Rick Saddler, Doug Campbell, Ed Carter, Steve Risner is to be considered financial or trading advice. All information is intended for Educational Purposes Only. Terms of Service.

Rick Saddler, Doug Campbell, Ed Carter, Steve Risner is not a licensed financial adviser nor does he offer trade recommendations or advice to anyone.

*******************************************************************


UAA Bullish Above $20.80, Stop $20.30 Price Action Bullish Morning Star T-Line Regression

Subscribe to my youtube Channel for free education

UAA Bullish Above $20.80, Stop $20.30

UAA bullish above $20.80, Stop Near $20.30 UAA daily chart price action – Bullish Morning Star, pop over the T-Line Regression Lines and five a month downtrend line breakout, support and rest with a Billish Engulf yesterday. UAA weekly chart price action – (RBB) Rounded Bottom Breakout, test the Dotted Duece, PBO to the 50-SMA, Bullish Engulf with Doji Continuation over the downtrend line. UAA is looking like a 16% stock trade to the June highs with profit zones along the way. The option trade could be in the 80-100% area.


[images style=”0″ image=”http%3A%2F%2Fhitandruncandlesticks.com%2Fwp-content%2Fuploads%2F2018%2F09%2FRBB-Click-Here.png” width=”939″ link_url=”https%3A%2F%2Fob124-10cd91.pages.infusionsoft.net%2F” align=”center” top_margin=”0″ full_width=”Y”]


 “Base Hits Wins The Game”

Past performance is not indicative of future returns

Good Trading, Rick, and Trading Team

____________________________________________________________

SPY 

The SPY tested our Lower T-Line Regression Line yesterday and held only by skin. The V-Stop and price action is suggesting we see a bit more weakness. Too much weakness and we could see the $288.15 and $286.40 areas which would be a test of the January highs.

****VXX – Tuesday the VXX painted a Bullish Engulf and yesterday the paint continued with bullish follow through.  At this rate, we might see price action reach for the T-Line Regression Lines, over the green one and we better buckle up.

Focus Trading Education

Candlesticks • Price Action • T-Line • T-Line Bands • Support • Resistance • Trend • Trendlines • Chart Patterns • Buy Box • Volatility Stops • Profit Zones • Entry Zones • Protective Stops • RBB Rounded Bottom Breakout Strategy • Pop Out of The Box Strategy • Pinball Strategy • Trade Planning, Fibonacci, Stoch/RSI

Subscription PlansPrivate 2-Hour Coaching

Testimonial

This is not your usual service that sends out a ton of stock recommendations, and then cherry picks the winners to show you how great they are. Hit and Run Candlesticks and Right Way Options are truly educational services. They taught me how to trade not what to trade. The entire team: Rick, Doug, Steve, and Ed are there to help and answer your questions. They are awesome. They cut years off my learning curve. And it’s a team effort. Everyone in the room (all the members) are there to help with invaluable insights and advice. The only service you will ever need. Thanks to all the team for how you have helped me and for all you do. –Jonathan Bolnick

Rare to have a service teach you how they find their choices but, HRC/RWO teach you how to fish instead of fishing for you. And, your ideas are not panned but shared, implemented, or improved. Sharing is caring. –Thomas Bradly


Past performance is not indicative of future returns

Investing and Trading involve significant financial risk and is not suitable for everyone. No communication from Hit and Run Candlesticks Inc, Right Way Option, Trader Vision 2020, Top Gun Futures or Rick Saddler, Doug Campbell, Ed Carter, Steve Risner is to be considered financial or trading advice. All information is intended for Educational Purposes Only. Terms of Service.

Rick Saddler, Doug Campbell, Ed Carter, Steve Risner is not a licensed financial adviser nor do they offer trade recommendations or advice to anyone.


Price Gyrations

Price Gyrations

Price GyrationsThe market experienced the typical price gyrations after the Fed put all its card on the table yesterday afternoon.  Sellers were expressing their disappointment at the close, but this morning the Futures are trying to open the day positive.  With several market-moving reports before the open anything is possible and swing traders may still find it difficult to find an edge this morning.

Overall trends are still bullish, but the bulls are currently struggling to find inspiration with the Fed projecting more rate increases on the way.  However, the bears are also struggling and thus far have not had the inspiration to maintain a serious threat.  As the indexes test the strength of current trends, watch for the potential of quick reversals and whipsaw.  Our edge will return, but we must wait for it and avoid forcing trades as the market thrashes around trying to find a directional conviction.

On the Calendar

A very busy day on the Economic Calendar today.  At 8:30 AM we have four potential market-moving reports. Durable Goods Orders, GDP, International Trade in Goods and Jobless Claims.  Also at 8:30 AM, Corporate Profits, Retail Inventories, and Wholesale Inventories.  Pending Home Sales come out at 10:00 AM followed by the EIA Natural Gas report at 10:30.  The Kansas City Fed Manufacturing index is at 11:00 AM with 3-Bond events between 11:00 AM and 1:00 PM.  We have two Fed Speakers this afternoon with Kaplan at 2:00 PM and the Fed Chair at 4:30 PM.  Farm price @ 3:00 PM with the Fed Balance Sheet and Money supply to close the calendar day at 4:30 PM.

On the Earnings Calendar, we have 19 companies reporting today.  Before the bell, CAG, CCL, MKC, and RAD are among those reporting.  After bell AEHR & CAMP reports along with three others.

Action Plan

After the Fed announced a 25 basis point rate increase and suggested, there are four more possible increases possible the launched into its normal gyrations but ended the day with the market expressing some disappointment.  The Dow closed down 106 points but stopped short of breaking the current uptrend.  The SP-500 and the NASDAQ also ended the day with sellers in control but held onto the bullish trends at the close while the Russell slid sharply south closing below its short-term trend.

Asian markets closed down across the board with European markets currently flat to mostly lower.  US Futures continue to sing from the same sheet of music pumping up for a bullish open this morning.  However with 8-Economic Reports an hour before the open, four of which are potential market-movers anything is possible.  The best we can do is wait and watch for a directional conviction.

Trade Wisely,

Doug

[button_2 color=”green” align=”center” href=”https://youtu.be/-Sa8wh03umQ”]Morning Market Prep Video[/button_2]

UAA Setup and Trade Plan

Today’s Featured Trade Idea is UAA.

Members can join us in Trading Room #1 as Rick reviews the UAA setup and other Trade-Ideas at 9:10am Eastern.  For now, here are my own analysis and a potential trade plan made using our Trader Vision 20/20 software.

UAA has been in a downtrend all summer. This includes several failures to break the downtrend. In the last week, a Trader’s Best Friend Signal started the last run up to retest. This time, UAA broke through and held a S/R level. Finally, on Wed. it printed a Bullish Engulfing signal that broke through and closed above the downtrend.

I will be looking for an inside day buy (on a successful retest of the downtrend), using a Stop below the S/R level that held the last 3 days. The 3 target prices come from S/R levels seen in daily and longer-term charts and represent a run up to the pre-downtrend highs.

Trader Vision shows us we should have a month until the next earnings report. It also tells us we have 3 Bullish (should be 4) and 3 Bearish Conditions. The larger number of bearish conditions is to be expected since this ticker has been in a downtrend for a few months.

TV20/20 tells us this trade plan offers a low risk ($105) to Stop, while giving a nice Reward potential at each of the 3 Target prices. If we follow this plan, we can achieve an overall trade of almost 5:1 Reward/Risk, while making almost 12% profit and banking $521.50 in gains.

Having this knowledge before a trade is even entered makes it much easier to control emotions and maintain discipline.

Below is my markup of the chart and the trade plan as laid out by Trader Vision 20/20.  As a bonus, if you click the green button below, you’ll be able to watch a video of the chart markup and trade planning process.

The UAA Trade Setup – As of 9-26-18

UAA Chart Setup as of 9-26-18

The Trade Plan

UAA Trade Plan for 9-27-18

Note how Trader Vision 20/20 does so much of the work for you.  Knowing the ratio of Bullish Conditions to Bearish ones as well as the overall risk of the position size, risk to Stop out and the Reward possible at each Target price can help a great deal with controlling our emotions.  Knowing the dollar impact of every scenario ahead of time, allows us to make calm decisions during the trade.  It really takes the pressure off.  No guesswork.  No surprises.  No emotional roller coaster.

To see a short video of this trade’s chart markup and trade planning, click the button below.


[button_2 color=”light-green” align=”center” href=”https://youtu.be/UV4fTplXrCY” new_window=”Y”]Trade Plan Video[/button_2]

Put the power to Trader Vision 20/20 to work for you…

[button_2 color=”orange” align=”center” href=”https://hitandruncandlesticks.com/product/trader-vision-20-20-monthly-subscription2/” new_window=”Y”]TV20/20 Software[/button_2]


Testimonial

Trader Vision immediately simplified the process…immediately it provided that information and guidance to me. I knew what I would risk for how much reward, I began taking trades off at the 1st target, 2nd target, I was no longer holding all my trades for the homerun. I also began implementing the stop losses if and when they were reached, not just hoping the stock would recover.  It then became easier to see what patterns were working for me and which were not.  It provided a much more relaxed and stress-free environment. –Joan G


***************************************************************************************************

Investing and Trading involve significant financial risk and are not suitable for everyone. Ed Carter is not a licensed financial adviser nor does he offer trade recommendations or investment advice to anyone. No communication from Hit and Run Candlesticks Inc. is to be considered financial or trading advice. All information is intended for Educational Purposes Only. Terms of Service.

***************************************************************************************************