
AGX 2Day Setup and Plan Beware this market!
Today’s Featured Trade Idea is AGX (This is planned/analyzed off a 2Day chart…not normal practice for me.)
Members can join us in Trading Room #1 as Rick reviews this setup and other Trade-Ideas at 9:10am Eastern. For now, here are my own analysis and a potential trade plan made using our Trader Vision 20/20 software.
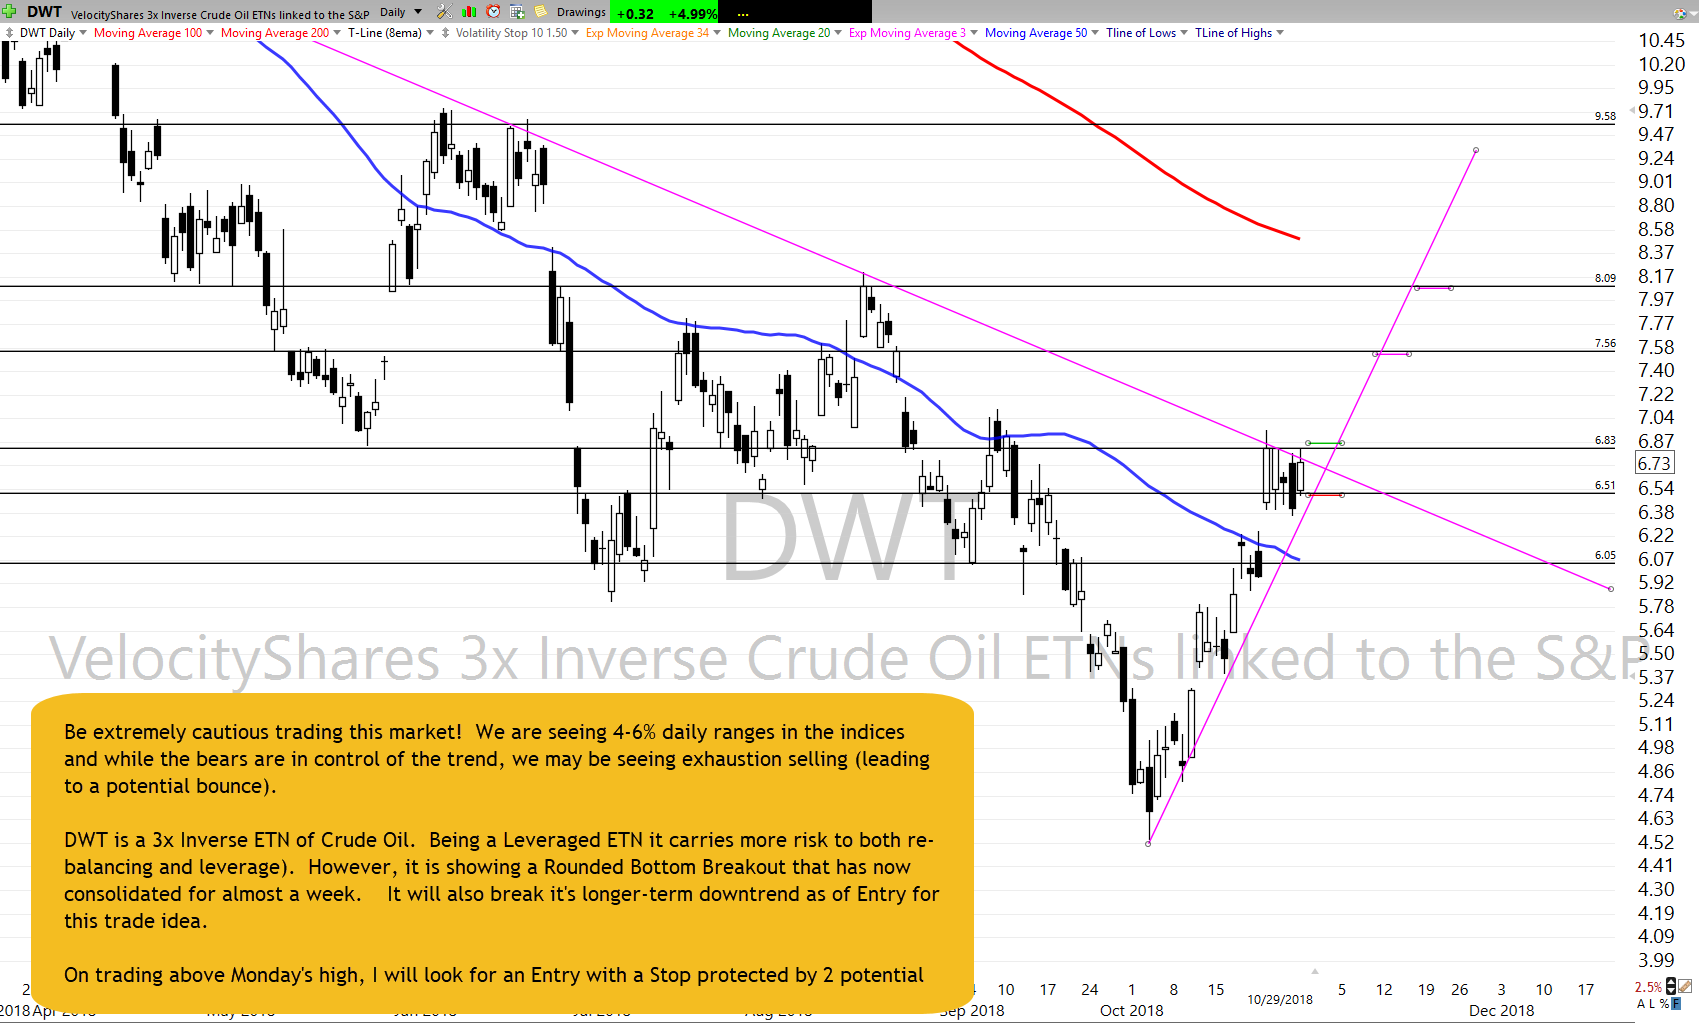
Be extremely cautious trading this market! We are seeing 4-6% daily ranges in the indices and while the bears are in control of the trend, we may be seeing exhaustion selling (leading to a potential bounce).
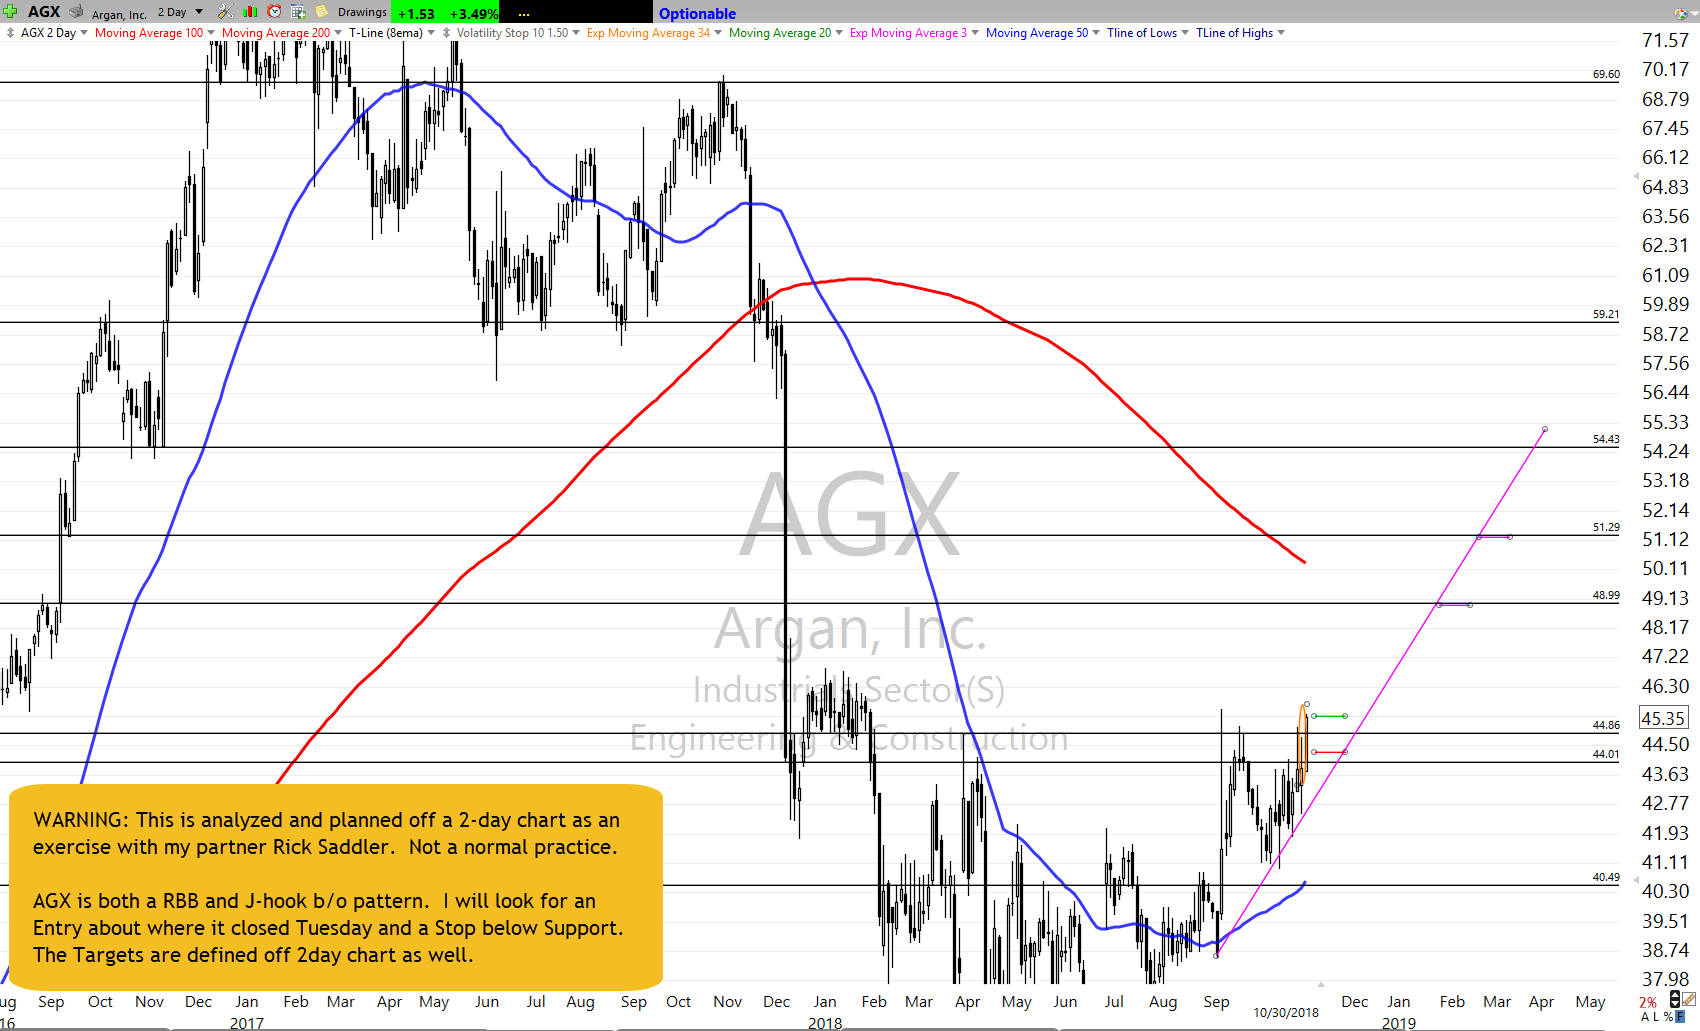
WARNING: This is analyzed and planned off a 2-day chart as an exercise with my partner Rick Saddler. Not a normal practice.
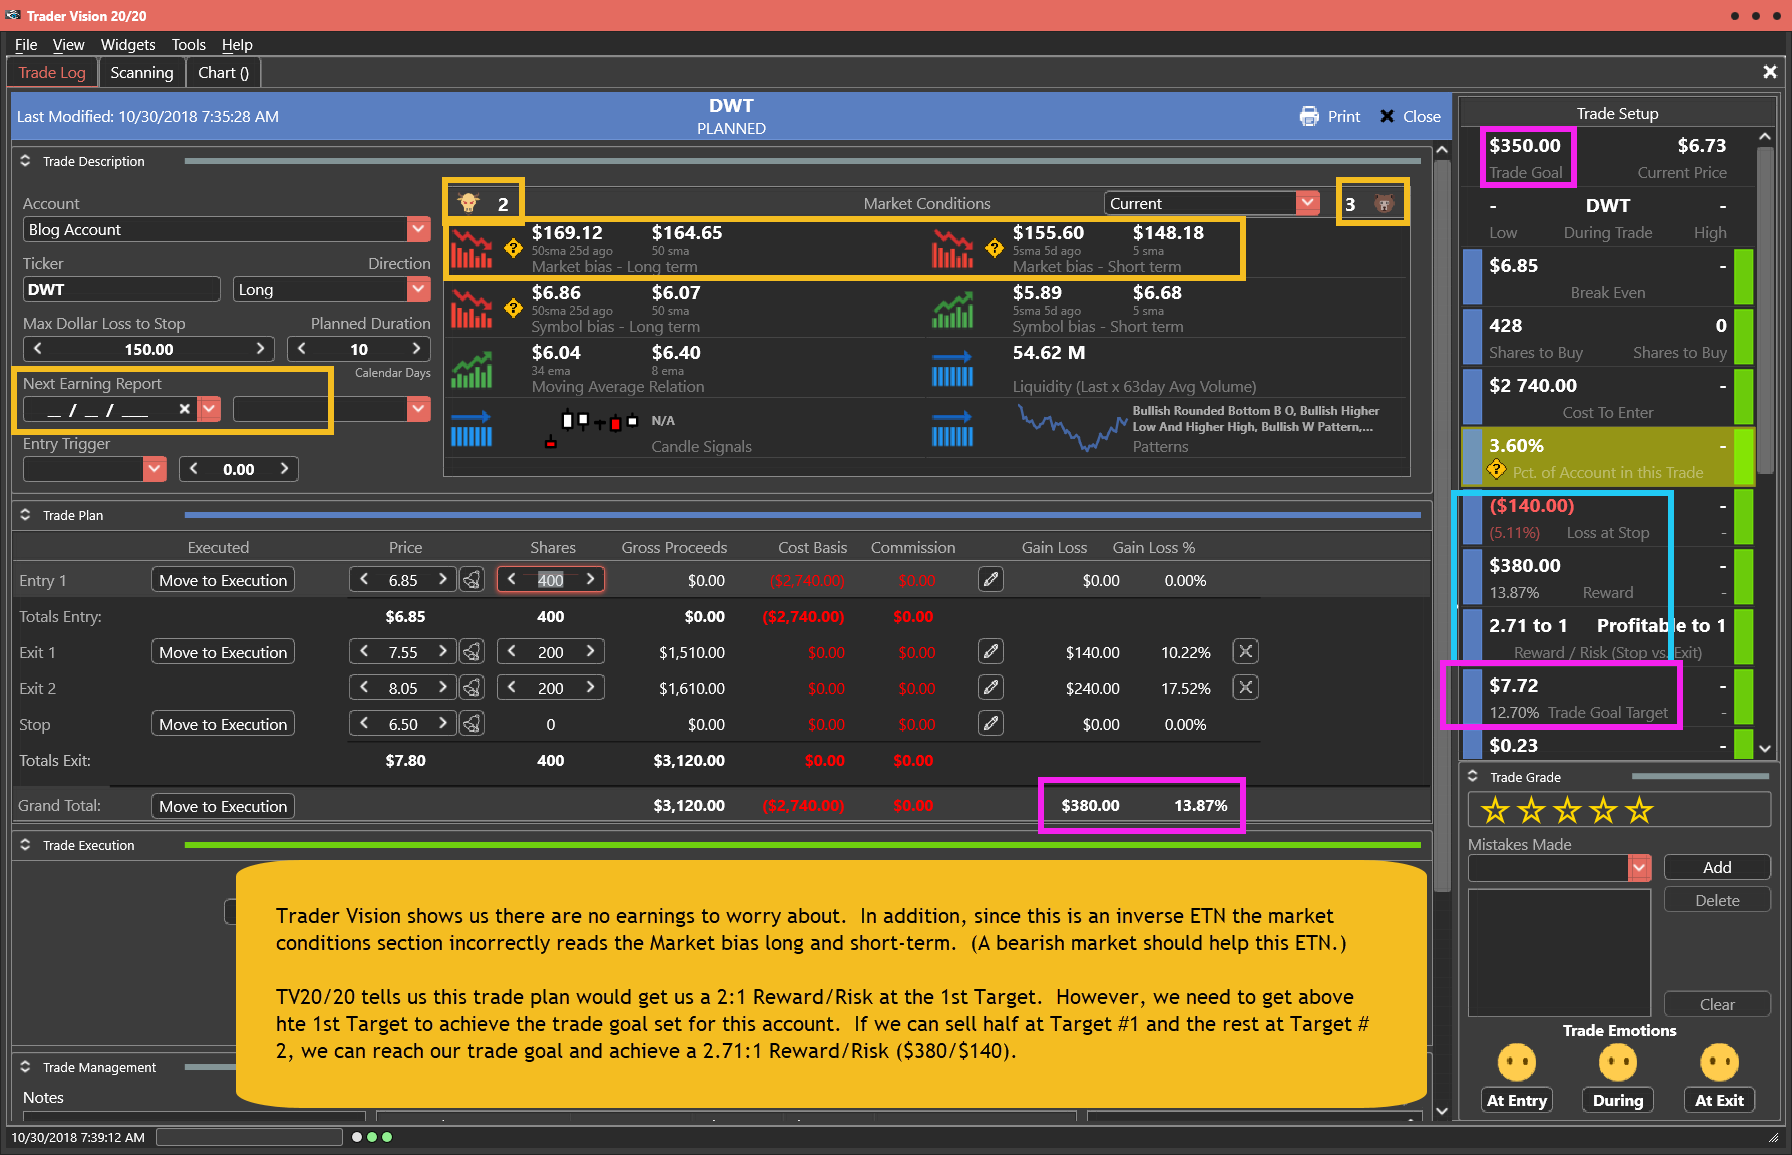
AGX is both an RBB and J-hook b/o pattern. I will look for an Entry about where it closed Tuesday and a Stop below Support. The Targets are defined off 2day chart as well.
If executed as planned, it would yield a 3.65/1 Reward/Risk.
Having this knowledge before a trade is even entered makes it much easier to control emotions and maintain discipline.
Below is my markup of the chart and the trade plan as laid out by Trader Vision 20/20. As a bonus, if you click the green button below, you’ll be able to watch a video of the chart markup and trade planning process.
The AGX Trade Setup (2-day chart) – As of 10-30-18
The Trade Plan
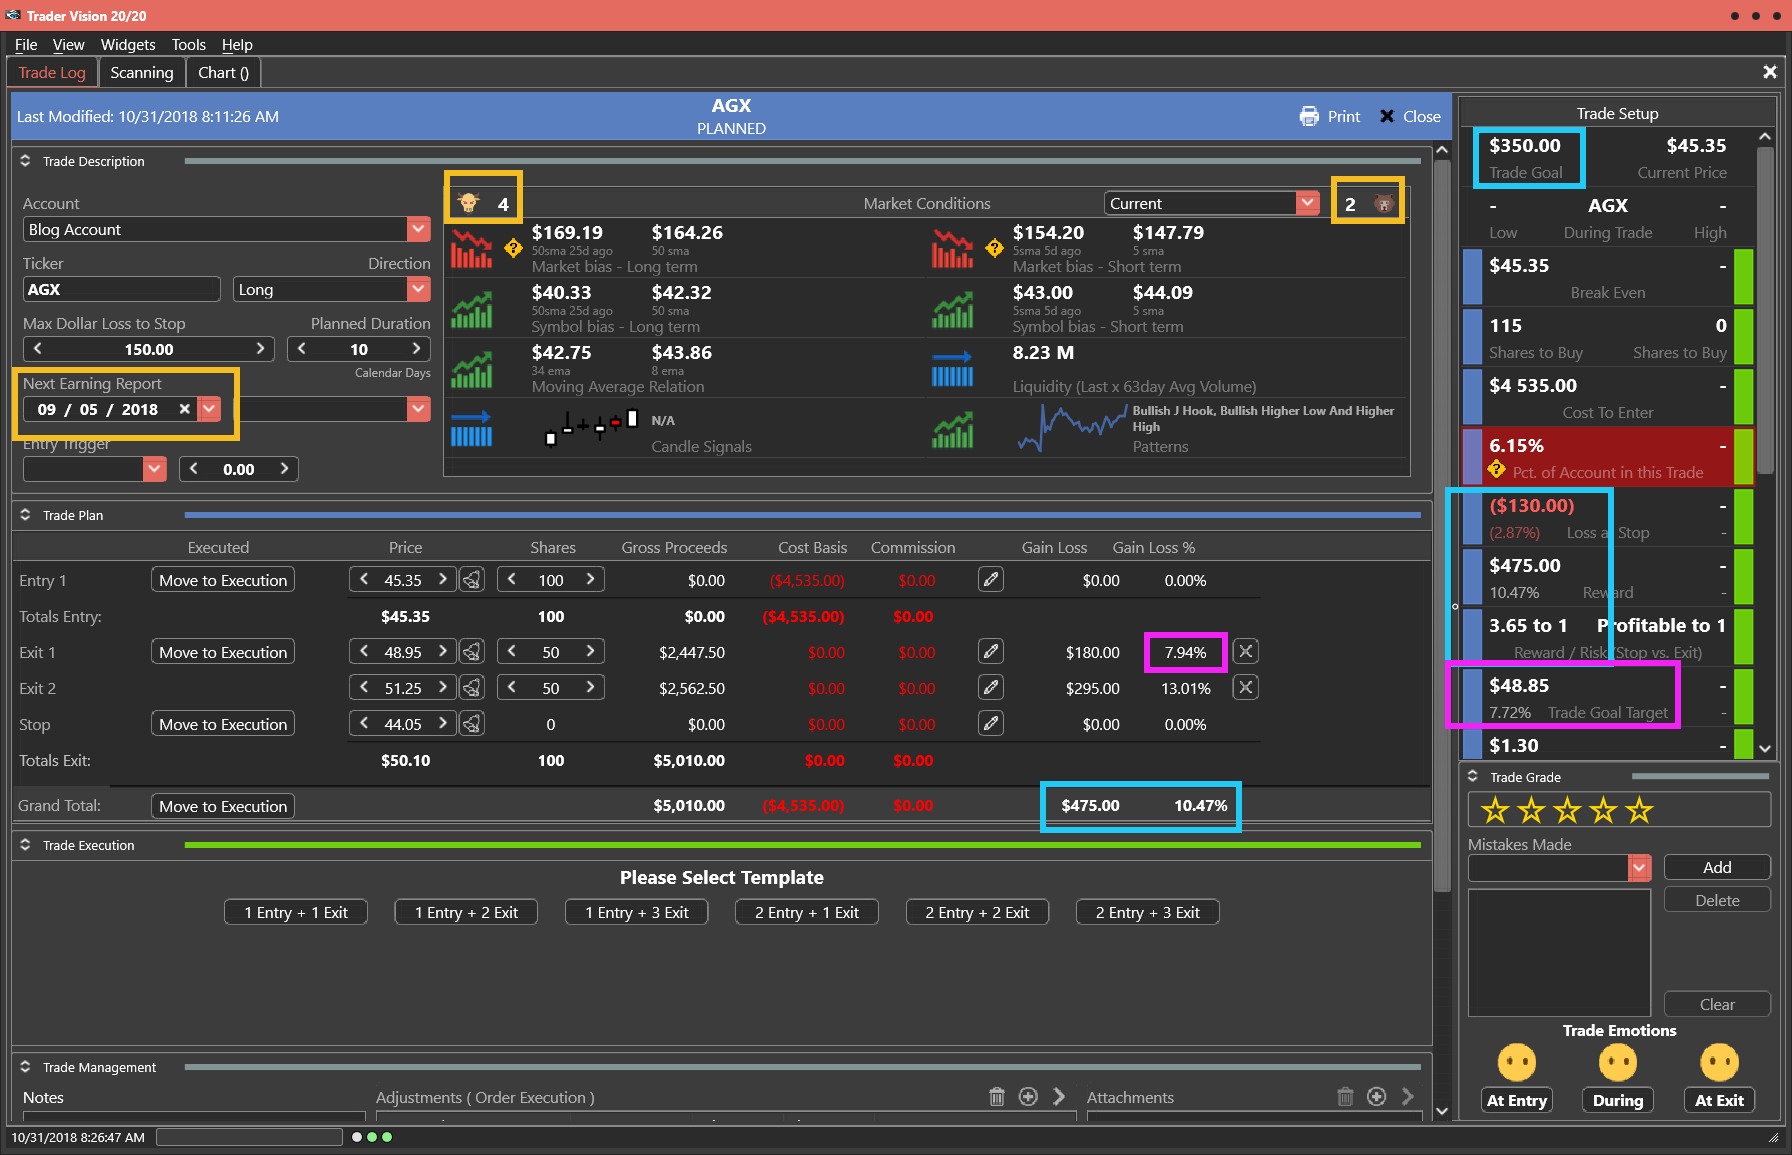
Note how Trader Vision 20/20 does so much of the work for you. Knowing the ratio of Bullish Conditions to Bearish ones as well as the overall risk of the position size, the risk to Stop out and the Reward possible at each Target price can help a great deal with controlling our emotions. Knowing the dollar impact of every scenario ahead of time, allows us to make calm decisions during the trade. It really takes the pressure off. No guesswork. No surprises. No emotional roller coaster.
To see a short video of this trade’s chart markup and trade planning, click the button below.
[button_2 color=”light-green” align=”center” href=”https://youtu.be/prOqPvNTiX0″ new_window=”Y”]Trade Plan Video[/button_2]
Put the power to Trader Vision 20/20 to work for you…
[button_2 color=”orange” align=”center” href=”https://hitandruncandlesticks.com/product/trader-vision-20-20-monthly-subscription2/” new_window=”Y”]TV20/20 Software[/button_2]
Testimonial
Trader Vision immediately simplified the process…immediately it provided that information and guidance to me. I knew what I would risk for how much reward, I began taking trades off at the 1st target, 2nd target, I was no longer holding all my trades for the homerun. I also began implementing the stop losses if and when they were reached, not just hoping the stock would recover. It then became easier to see what patterns were working for me and which were not. It provided a much more relaxed and stress-free environment. –Joan G
***************************************************************************************************
Investing and Trading involve significant financial risk and are not suitable for everyone. Ed Carter is not a licensed financial adviser nor does he offer trade recommendations or investment advice to anyone. No communication from Hit and Run Candlesticks Inc. is to be considered financial or trading advice. All information is intended for Educational Purposes Only. Terms of Service.
***************************************************************************************************
 Bullishness in the Asian and European market has the US Futures suggesting the first possible follow-through rally in nearly a month! Certainly exciting to see but as the indexes challenge price resistance levels, we can’t rule out the possibility of profit-taking. As a result, traders will need to say on their toes focused on price action and aware of the current market volatility.

 Without a doubt, yesterday was an ugly ride, but it also revealed a possible silver lining. Where was the silver lining? In the last 15 minutes of the day, we experienced a huge bounce that can only occur when the big institutions finally step in to snap up the bargains and defend the lows. We still need proof of that with a follow-through rally today. Make no mistake, if this is a short-term bottom the price action will still be very challenging to trade.
 I see a lot of conversation in the press, and across social media using the term oversold. While that might be true, oversold does not automatically translate into bullishness or a reason to rush into risk! Take a close look at the daily charts, and you will see there is currently nothing in the price action that should engender confidence that the bulls are ready to take control. Remember the fear of missing out is an emotion and not a valid reason to buy!

