
The meeting of minds, the meeting of waters . . . Amazing things can happen when two great powers meet. Although the meeting of lines in a candlestick pattern isn’t exactly momentous, it is both simple and rare. The Bullish Meeting Lines pattern involves just two candles: one black and one white. This pair of candlesticks meets at the close, meaning that the closing price of the second (bullish) candle is equal to the closing price of the first (bearish) candle. However, because the Bullish Meeting Lines pattern is similar to other signals, as we will discuss below, it can be difficult to spot—so take your time and keep an eye on the details.
Bullish Meeting Lines Pattern
Formation
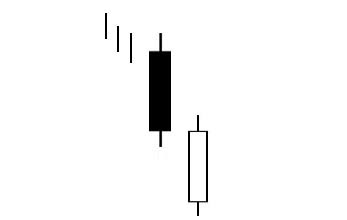
Although the Bullish Meeting Lines pattern consists of only two candles, that does not mean that it is easy to spot. Because it closely resembles other signals, you should carefully verify the following criteria before proceeding:
First, the market must be defined by a downtrend. Second, a long black candlestick must appear on the first day. Third, a long white candlestick must appear on the second day. Fourth and finally, the white candle must have the same closing price (or very near the same closing price) of the preceding day.
Check through this (admittedly simple) criteria carefully, because the Bullish Meeting Lines is quite similar to the following signals:
- In Neck (The difference? In this nearly identical pattern, in which the white candle closes at or slightly above the close of the black candle, the second candle is shorter than it is in the Bullish Meeting Lines pattern.)
- On Neck (The difference? In this pattern, the white candle should nearly match the black candle’s low and cannot rise above it.)
- Bullish Piercing (The difference? In this pattern, the white candle closes above the black candle’s midpoint.)
- Thrusting Line (The difference? In this pattern, the white candle pushes into the black candle’s body, closing near but below the midpoint of the black candle.)
Meaning
Although the Bullish Meeting Lines pattern isn’t as consequential as some of the signals it resembles, such as the Bullish Piercing pattern, it still deserves your respect. It conveys a stalemate between the bulls and the bears . . .
The market is in the midst of a downtrend, which is further supported by the appearance of a strong black candle. Then, the following day opens quite low, giving the bears even more confidence in the market’s downward price movement. However, the bulls begin a counterattack that thrusts the price upward. In the end, the day closes at the exact same place the previous day closed (or very near to it). The downtrend has ended.
Typically, this means that a bullish reversal has occurred, but the Bullish Meeting Lines pattern is not especially reliable. So before you make any big moves, watch the market and wait for confirmation. After all, just because the “lines” have met, that doesn’t mean you should pounce on the implications of this bullish candlestick pattern.
If you’re interested in mastering some simple but effective swing trading strategies, check out Hit & Run Candlesticks. Our methods are simple, yet powerful. We look for stocks positioned to make an unusually large percentage move, using high percentage profit patterns as well as powerful Japanese Candlesticks. Our services include coaching with experienced swing traders, training clinics, and daily trading ideas. To sign up for a membership, please click here.


Comments are closed.