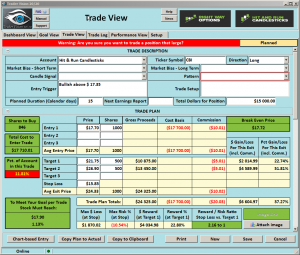
CBI – Bullish Over $17.35
CBI – Bullish over $17.3 5 or maybe on an inside day entry of yesterdays candle with a stop at or below $15.30. The CBI chart has been constructing a bottom for a few months trying to capture the 50-SMA. The 50-day SMA was successfully captured, and a Bullish Inverted Head and Shoulder was created. In the short term, several bullish candle and chart patterns have been created. (Can you find them)?
►CBI – Train Your Eyes, Can You Find the Following?
RBB pattern • Scoop pattern • Inverted Head and Shoulders • Bullish Engulf 3-day chart • Pop Out of The Box pattern on the weekly chart •
Good Trading – Hit and Run Candlesticks
► Ticker Update (CRC)
You could have profited more than 74% or about $600, with 100 shares when we posted to our members on September 13.
If you are interested in learning how to end the week with a profit that could change your life simply contact us. Rick Saddler founder of Hit and Run Candlesticks offers private recorded coaching • Coaching With Rick you can also learn this trading technique in our membership. – Get Started
► Eyes On The Market
WOW, yesterday was the 54th day closing above the lower purple T-Line Band in the SPY. I am getting asked all the time now “isn’t this market overbought” and I reply “Yes” but that has nothing to do with PRICE ACTION. Oversold /Overbought is a crutch for most traders, the trend and price action is where big money is. Remember that minor pullbacks in a trend are not a bearish reversal.
Rick’s trade ideas for the day – MEMBERS ONLY
30-Day Trial • Monthly • Quarterly • Semi-Annual • Annual
Investing and Trading involves significant financial risk and is not suitable for everyone. No communication from Hit and Run Candlesticks Inc. is financial or trading advice. All information is intended for Educational Purposes Only. Terms of Service.
Rick Saddler is not a licensed financial adviser nor does he offer trade recommendations or advice to anyone except for the trading desk of Hit and Run Candlesticks Inc.


Comments are closed.