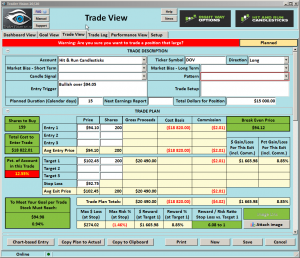
DOV – Trending Back Over The T-Line
 DOV (Dover Corp), The DOV Chart is trending and now back over the T-Line after a gap down followed by a bullish rush to stay afloat. On a 2-Day chart, you can see a clean Bullish Belt-Hold that’s closed above the T-Line, the upper T-Line and the Volatility Stop.
►Candle Pattern
2-Day Chart • Bullish Belt-Hold
Low-risk entries • Trade with us • Learn more with us • Profit with us •. You will not find a better trading support group, up to you.
Good Trading – Hit and Run Candlesticks
► Ticker Update (ACLS)
You could have profited about 16.55% or about $470.00, with 100 shares when we posted to our members on October 2nd.
If you are interested in trades and profits Rick Saddler founder of Hit and Run Candlesticks offers private recorded coaching • LEARN MORE
Learn more about Hit and Run Candlesticks, and today’s trade idea and plan plus the 10 or more members trade ideas, starting at 8:45 EST AM every morning with the HOG and then Rick at 9:10 EST. Every day we teach and trade using the T-Line, Candlesticks, Support and Resistance, Trends, chart patterns and continuation patterns.
► Eyes On The Market
The SPY seems to be possessed with Bullishness. My overall plan is to remain bullish and trade charts that are ready to pay or to pay me. Following the trend and price action is not only easy but rewarding as well.
With Friday’s close, we see support around the $256.00 area.
Rick’s trade ideas for the day – MEMBERS ONLY
Monthly • Quarterly • Semi-Annual • Annual
Investing and Trading involves significant financial risk and is not suitable for everyone. No communication from Hit and Run Candlesticks Inc. is financial or trading advice. All information is intended for Educational Purposes Only. Terms of Service.
Rick Saddler is not a licensed financial adviser nor does he offer trade recommendations or advice to anyone except for the trading desk of Hit and Run Candlesticks Inc.


Comments are closed.