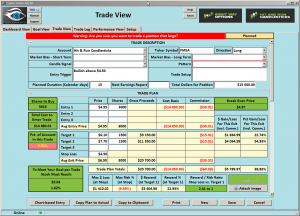
FMSA – Bullish Consolidation and Finding Support
 FMSA (Fairmount Santrol Holdings) The FMSA Chart has presented us with a trending Rounded Bottom Breakout chart, T-Line Run, five days of consolidation, a Bullish Morning Star on big volume, a Pop Out of The Box setup and a ♪♫♪Partridge In A Pear Tree.♪♫♪
►Starting at 9:10 EST every morning we cover:
How to trade each HRC trade idea with entry, stop and profit zones. Answer questions to help you succeed in trading.
Monthly • Quarterly • Semi-Annual • Annual • Change your future and enjoy the life of working from home with swing trading. The next step is up to you.
Good Trading – Hit and Run Candlesticks
Learn more about Hit and Run Candlesticks, and today’s trade idea and plan plus the 10 or more members trade ideas, starting at 8:45 EST AM every morning with the HOG and then Rick at 9:10 EST. Every day we teach and trade using the T-Line, Candlesticks, Support and Resistance, Trends, chart patterns and continuation patterns.
►Trade Updates for Hit and Run Candlesticks
We bought [ZYNE] and [I] yesterday based on the chart patterns and the price action. Learn more on why we bought and what we expect to profit from the chart.
Monthly • Quarterly • Semi-Annual • Annual • We control our risk and manage our gains • We teach the Same • Cancel Anytime
► Ticker (ZYNE) – You could have profited about 12.54% or about $109.00,
If you had bought 100 shares when we posted to our members on October 3.
► Eyes On The Market (SPY)
The SPY closed on another new high yesterday, that’s five days up in a row. If you are a T-Line follower, we have a bullish T-Line Run. We still have a bullish outlook with minor PBO’s along the way. The T2122 chart suggests we may see a little profit taking in the market, of course, the final decision is up to the price.
► What is a Trade Idea Watch-list?
A trade idea watchlist is a list of stocks that we feel will move in our desired direction over a swing trader’s time frame. That time could be one to 15 days for example. From that watch list, we wait until price action meets our conditions for a trade.
Rick’s trade ideas for the day – MEMBERS ONLY
Monthly • Quarterly • Semi-Annual • Annual
Investing and Trading involves significant financial risk and is not suitable for everyone. No communication from Hit and Run Candlesticks Inc. is financial or trading advice. All information is intended for Educational Purposes Only. Terms of Service.
Rick Saddler is not a licensed financial adviser nor does he offer trade recommendations or advice to anyone except for the trading desk of Hit and Run Candlesticks Inc.


Comments are closed.