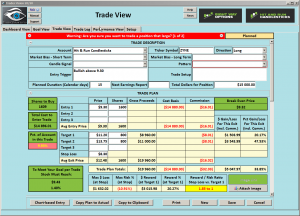
ZYNE – Pullback To The 50-SMA
ZYNE (Zynerba Pharmaceuticals) The ZYNE Chart has presented us with a Morning Star reversal signal followed by a gap. Price is currently in your Rounded Bottom Breakout Zone with a pullback and Doji on the 50-SMA.
►Starting at 9:10 EST every morning we cover:
How to trade each HRC trade idea with entry, stop and profit zones. Answer questions to help you succeed in trading.
Monthly • Quarterly • Semi-Annual • Annual • Change your future and enjoy the life of working from home with swing trading. The next step is up to you.
Good Trading – Hit and Run Candlesticks
Learn more about Hit and Run Candlesticks, and today’s trade idea and plan plus the 10 or more members trade ideas, starting at 8:45 EST AM every morning with the HOG and then Rick at 9:10 EST. Every day we teach and trade using the T-Line, Candlesticks, Support and Resistance, Trends, chart patterns and continuation patterns.
►Trade Updates for Hit and Run Candlesticks
We bought SEAS yesterday based on the chart patterns and the price action. Learn more on why we bought and what we expect to profit from the chart.
► Ticker (PBYI) – You could have profited about 15.97% or about $1650.00
If you bought 100 shares when we posted to our members on September 25.
Monthly • Quarterly • Semi-Annual • Annual • We control our risk and manage our gains • We teach the Same • Cancel Anytime
► Eyes On The Market (SPY)
Another stellar day for the bulls breaking record highs. Not much I can say about the charts other than there’s a bullish party going on! Let’s remember sometimes the party can get carried away at times and there needs to be a grounding. As the responsible one at parties, I never let anyone drink and drive. This party is different, don’t keep partying without taking some profits. One of the most valuable things I have learned is to take profits from time to time. An example might be, when you reach double-digit gains close ½ the position and raise the stop. It’s a win-win.
► What is a Trade Idea Watch-list?
A trade idea watchlist is a list of stocks that we feel will move in our desired direction over a swing trader’s time frame. That time could be one to 15 days for example. From that watch list, we wait until price action meets our conditions for a trade.
Rick’s personal trade ideas for the day MEMBERS ONLY
Monthly • Quarterly • Semi-Annual • Annual
Investing and Trading involves significant financial risk and is not suitable for everyone. No communication from Hit and Run Candlesticks Inc. is financial or trading advice. All information is intended for Educational Purposes Only. Terms of Service.
Rick Saddler is not a licensed financial adviser nor does he offer trade recommendations or advice to anyone except for the trading desk of Hit and Run Candlesticks Inc.


Comments are closed.