T-Line Support
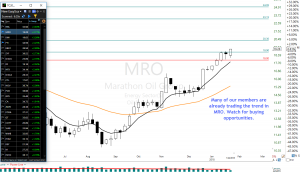
 The Price action in MRO presented a type of a Bullish Morning Star yesterday that fond support with the help of the T-Line as has the past 23 days, that’s what we call a T-Line Run. MRO is challenging the December 2016 highs (weekly chart) at the moment. A successful battle would suggest MRO may want to challenge the $25.00 area. To learn more about my trading tools join me in the trading room or consider Private Coaching.
Today At 9:10 AM ET. We will demonstrate live how MRO could be traded using our Simple Proven Swing Trade Tools
► Learn the Power Of Simple Trading Techniques
[button_2 color=”blue” align=”center” href=”https://hitandruncandlesticks.com/hrc-rwo-30-day-offer/” new_window=”Y”]30-Day Trial • HRC • RWO • $14.00 Each • No Auto Bill[/button_2]On September 13, we shared CRC and how to use the trading tools listed below to profit. Yesterday the swing profits would have been about 184% or $1500.00 with 100 shares. Using our Simple, Proven Swing Trade Tools and techniques to achieve swing trade profits. CRC printed a Bullish Morning Star yesterday with T-Line support.
Candlesticks • Price Action T-Line • T-Line Bands • Support • Resistance • Trendlines • Chart Patterns • Buy Box • Volatility Stops • Profit Zones • Entry Zones • Protective Stops • RBB Rounded Bottom Breakout Strategy • Pop Out of The Box Strategy • Pinball Strategy • Continuation Patterns • Trade Planning… Learn More
► Eyes On The Market
So the children in DC came to some agreement, for the time being anyway. Yesterday the SPY did what it seems to do best… climb higher. This starting to sound like a broken record, The markets bullish, the bull trend is supporting, tada, yadda, yadda. Every day I watch price and how it acts around the 8-day trend using the T-Line, and its sisters. I must admit the T-Line family has supported price very well of late. So it would stand to reason if the T-Line family fails price we could see a little seeling. My point is – Watch how price and the T-line work together.
The VXX short-term futures slide a little yesterday closing below the T-Line trend but did not close below the January 16 candle. Note the January 16 candle is the candle making the VXX interesting. Keep reading the VXX chart; the story may not be over. Those 2 Dojis lead to a bullish gap day which is now leading to more healthy bottom construction.
►Rick’s Swing Trade ideas
Member Login – Full Daily List
30-Day Trial • Monthly • Quarterly • Semi-Annual • Annual
Candlesticks • Price Action T-Line • T-Line Bands • Support • Resistance • Trendlines • Chart Patterns • Buy Box • Volatility Stops • Profit Zones • Entry Zones • Protective Stops • RBB Rounded Bottom Breakout Strategy • Pop Out of The Box Strategy • Pinball Strategy • Continuation Patterns
Investing and Trading involves significant financial risk and is not suitable for everyone. No communication from Hit and Run Candlesticks Inc. is financial or trading advice. All information is intended for Educational Purposes Only. Terms of Service.
Rick Saddler is not a licensed financial adviser nor does he offer trade recommendations or advice to anyone except for the trading desk of Hit and Run Candlesticks Inc.
*************************************************************************************


Comments are closed.