A Smooth Breakout for GCO
 GCO recently tested the 200-SMA after a smooth breakout on the daily chart. In the current GCO daily chart, a few clues popping out to me. One, the Bullish engulf off the 50 and 200-SMA, the Bullish Flag pulls back and then there the not so perfect Bullish Morning Star reversal clue. Drill up to the 2-3-4-and 5-day charts, and you will find the RBB chart pattern set up for the RBB trading strategy. FYI. The weekly Morning Star is a beauty.
Have you ever asked yourself why someone will make a darn good profit on a trade and someone else may struggle for a dime or even lose money on the same trade?
[button_2 color=”blue” align=”center” href=”https://hitandruncandlesticks.com/hrc-rwo-30-day-offer/” new_window=”Y”]Learn and Earn • 30-Day Trial[/button_2]
►Up Coming Events
- Professional Traders Sumit – 15% discount ends this week. Click Here Learn More
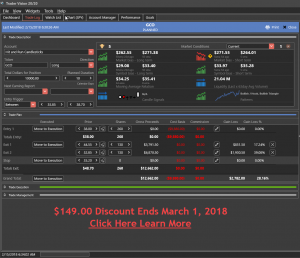
- Trader Vision $149.00 discount ends March 1;Click Here Learn More
- See More events Event Calendar located at the top left of any webpage.
►SPY Up Date
The SPY has now closed for the last 3 bars above the Lower T-Line Band, today price just might push through the Upper Band and close above it as well. Price closed yesterday about 2 points away from the 50-SMA, a challenge today is likely. 3-4 points on either side of the 50-SMA are important for both the Buys and Sellers, the both will fight for the place, and this is the battleground.
►Learn Our Tools and Trading Techniques
On February 8, Rick shared SRNE as a trade for members to consider and how to use the trading tools listed below. Currently, the profits could have been about 68.5% or $335.00 with 100 shares. Using our Simple, Proven Swing Trade Tools and techniques to achieve swing trade profits.
Candlesticks • Price Action • T-Line • T-Line Bands • Support • Resistance • Trend • Trendlines • Chart Patterns • Buy Box • Volatility Stops • Profit Zones • Entry Zones • Protective Stops • RBB Rounded Bottom Breakout Strategy • Pop Out of The Box Strategy • Pinball Strategy • Trade Planning
►The VXX short-term futures
The VXX has been resting it’s bullish pasture and will likely dip below the 200-SMA today. On a side, note price is approaching the Fib 50% retracement.
►Rick’s Swing Trade ideas Reserved for Subscribing Members
30-Day Trial • Monthly • Quarterly • Semi-Annual • Annual
To learn more about our trading tools join us in the trading room or consider Private Coaching. Rick will help coach you to trading success.
Investing and Trading involve significant financial risk and is not suitable for everyone. No communication from Hit and Run Candlesticks Inc. is financial or trading advice. All information is intended for Educational Purposes Only. Terms of Service.
Rick Saddler is not a licensed financial adviser nor does he offer trade recommendations or advice to anyone except for the trading desk of Hit and Run Candlesticks Inc.
*************************************************************************************


Comments are closed.