Last Updated: May 1, 2017
Last week we discussed what happens when windows fall, so this week we’re watching them rise up again. Like its brother, the Rising Window candlestick pattern is a simple signal with an imaginative name. You might picture fallen windows taking flight, climbing with the help of a pulley, or simply floating up the sides of buildings. Despite its evocative title, the Rising Window candlestick pattern conveys a very basic message. To learn what that message is and how you can spot the signal, please scroll down.
Rising Window Candlestick Pattern
Formation
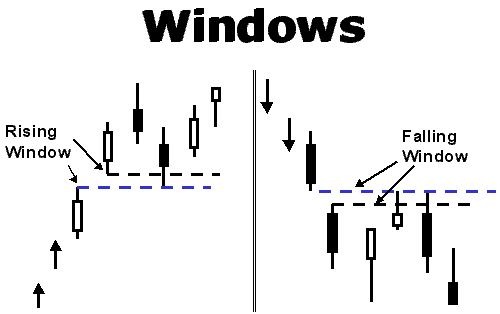
To form a Window (whether rising or falling), there must be a space between the real bodies of two candles; in fact, even their shadows should not overlap. A Rising Window is a price gap that forms during an uptrend.
A gap during an uptrend. That’s it. Really.
Also referred to as a “gap up,” the Rising Window must appear when the price is consistently rising, and it is always viewed as a bullish signal. Don’t be surprised when you see it; the Rising Window occurs frequently (though not as often on charts with longer time scales). Since this continuation pattern is so basic and prevalent, be sure that you take a good look at it to ensure that you thoroughly understand what it’s trying to tell you. Small details can convey great meaning.
Finally, as you’ve already learned, this pattern has a brother that gaps down. The Falling Window candlestick pattern is just as simple and sweet: a gap during a downtrend. Easy to spot, easy to understand.
Meaning
Now that you’ve mastered that very tough lesson regarding the formation of a Rising Window, let’s discuss what this pattern is trying to announce to investors. The space between the candles conveys a gap between the previous candle’s high and the current candle’s low. This movement shows that the bulls are feeling strong and healthy, and we can expect them to continue pushing the price up. To get a better hold on the pattern’s message, examine the size of the gap. A large gap signifies a dramatic jump in price, while a small gap is a relatively minor (and somewhat insignificant) hop.
If the two candles that follow a Rising Window don’t close the window or fill the gap (including their shadows), an Upside Gap Tasuki may have formed. Those two candles must be opposing colors (the first white, the second black), and the black candle must open inside the white candle’s body and close below it. This pattern conveys that after the uptrend, there is a pause as the bears try to force the price down. However, they’re unable to succeed. The gap is not closed, and we can assume that the uptrend will continue.
EXAMPLES
Although we know you won’t have any trouble locating Rising Window candlestick patterns, perusing some examples will help cement the formation and meaning of this signal in your mind. Using your newfound knowledge, locate the Rising Windows in the following examples and check out how they function within the charts.
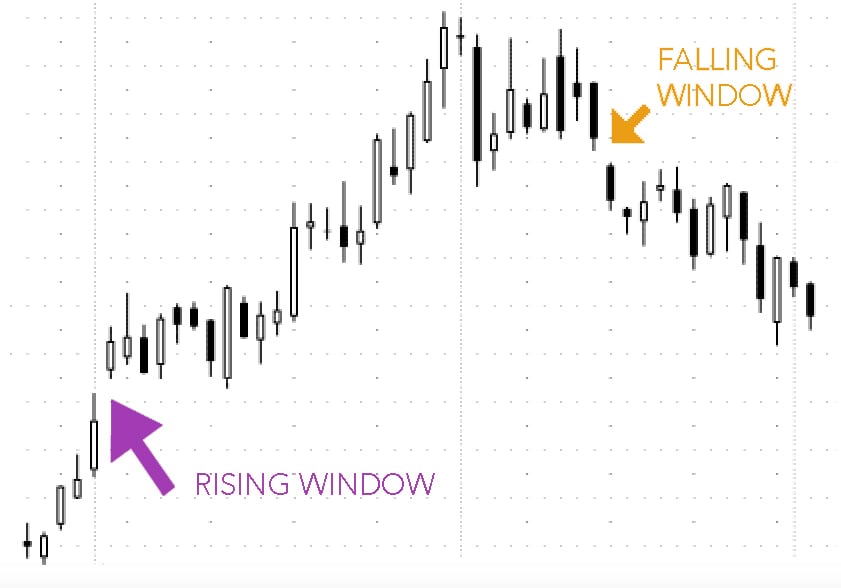
EXAMPLE 1:
You might recognize this first example from our post about Falling Window candlestick patterns. Since it contains both Window forms, it deserves a second chance in the spotlight. The chart begins with an uptrend. The bulls, showcasing their strength, form a gap up (i.e., a Rising Window) at the very start of the movement. The uptrend continues for about half of the chart, steeply climbing with mostly white candles. Then, when the trend finally reverses, the bears are so strong that they form a downward gap: a Falling Window. With both a gap up and a gap down, this pattern exhibits a significant change in investor sentiment.
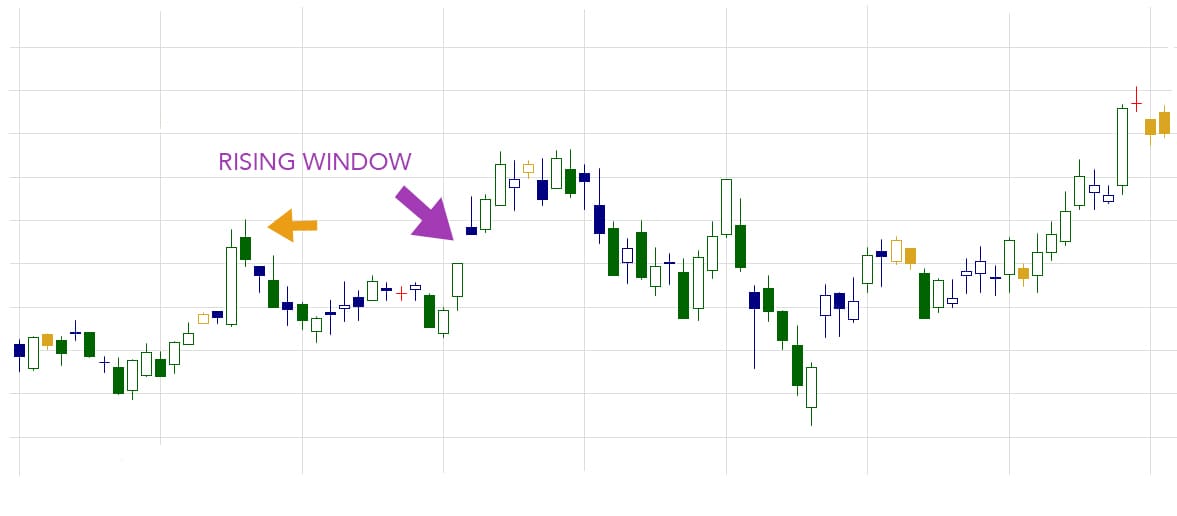
EXAMPLE 2:
In our second example, the bulls are persistent. They attempt to raise the price from the start, but they reach a point of resistance (conveyed by the yellow-orange arrow). When that attempt descends into failure, they try again. This time, when they reach the same point of resistance, they push back with force and form a gap up. Also known as a Rising Window, of course, the gap showcases the strength of the bulls. Unsurprisingly, they’re able to continue the uptrend from there.
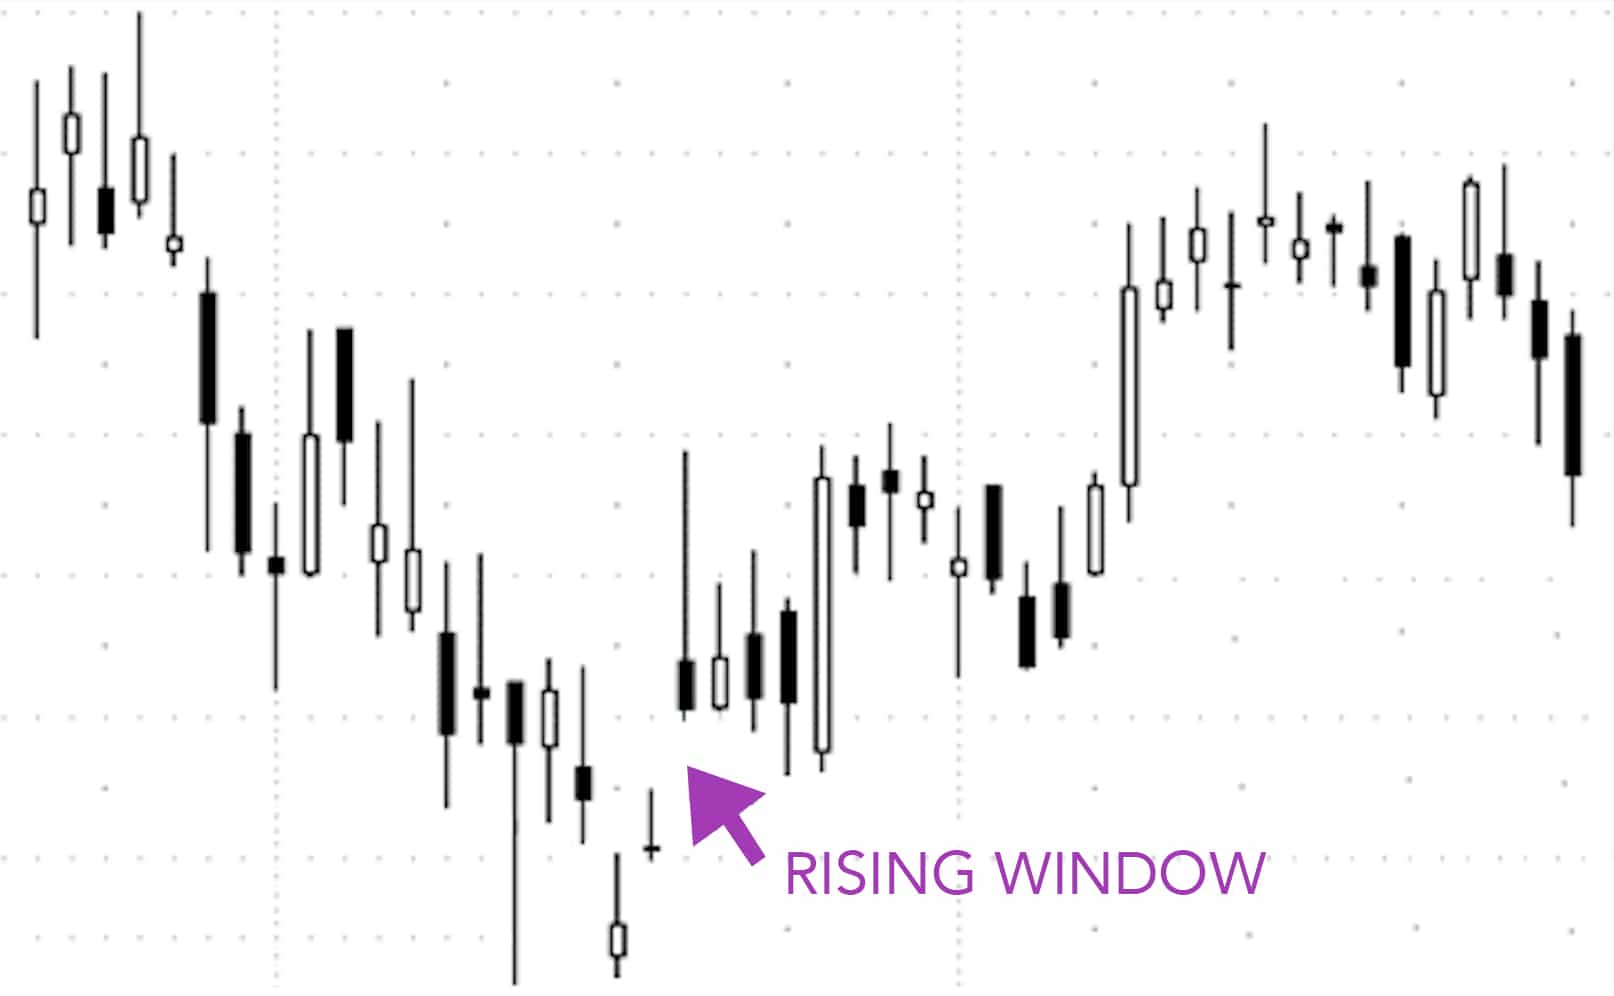
EXAMPLE 3:
When our third example begins, the bears dominate the chart. They swiftly force the price down with a number of long black candles. Once the bulls take the reins and reverse the trend, a Rising Window quickly appears. The large upward leap showcases the strength of the bulls. From there, the uptrend continues with two notably large white candles. If you sensed the strength of the bulls, as conveyed by the large Rising Window, this shouldn’t have been a shocking revelation.
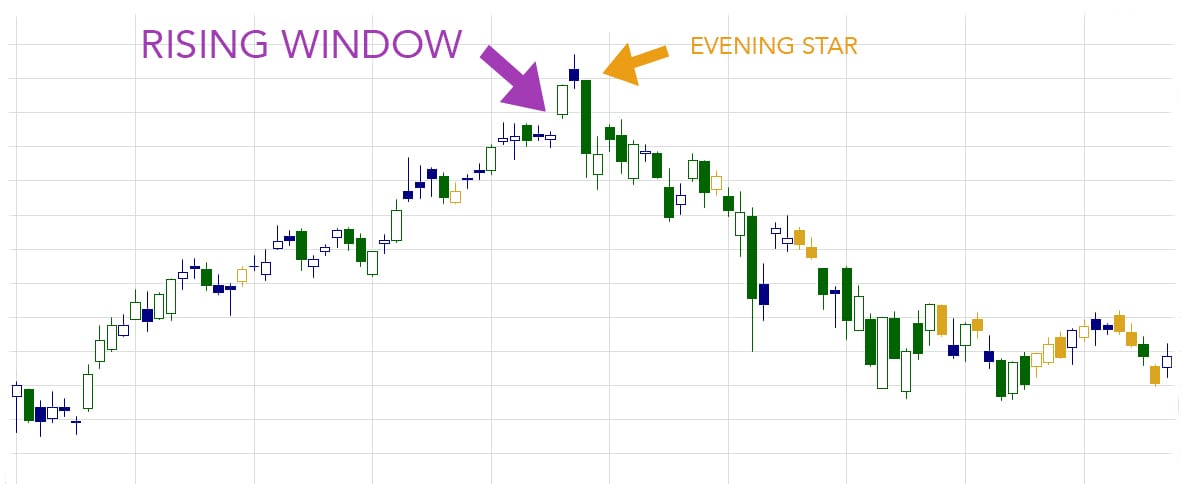
EXAMPLE 4:
What a mountain of a candlestick chart! In our final example, the first half of the chart shows a steady ascent. The bulls appear quite strong and even manage to produce a gap up (a Rising Window candlestick pattern). Despite this show of power, a reversal occurs soon after in the form of an Evening Star candlestick pattern. The fact that the last candle of the Evening Star is long, dipping far below the first candle of the pattern, increases the odds of a strong reversal. And as expected, the price then cascades downward, forming a downtrend that spans the entire second half of the chart.
_____
When you spot your first Rising Window candlestick pattern, be sure to check for confirmation. In this case, that would mean that the price continues to trade above the gap, preferably above the real body of the last candle.
Good luck!
If you’re interested in mastering some simple but effective swing trading strategies, check out Hit & Run Candlesticks. Our methods are simple, yet powerful. We look for stocks positioned to make an unusually large percentage move, using high percentage profit patterns as well as powerful Japanese Candlesticks. Our services include coaching with experienced swing traders, training clinics, and daily trading ideas. To sign up for a membership, please click here.



Comments are closed.