Pesky 50-SMA
The market (SPY) ran into the pesky 50-SMA and was pushed away ending the day with a long wick at the top and a very small body. The candle formation “Inverted Hammer” is a sign the sellers outnumber the buyers unless something changes overnight there is a high probability the next day’s open is lower. The failure at the 50-SMA is a Blue Ice Failure pattern and requires a qualified bullish reversal pattern to challenge and overcome the 50-SMA.
The downtrend is still in play with $259.00 acting as support for now. Price has now drawn a low to a high and today will draw a lower low. Watch the chart for the next clue to a bullish bottom construction or soggy bottom fall out. Looking at the 4-hour chart, we might be drawing a higher low, with follow-through over and a test of the $271.60 area might encourage the buyers to take another run at the pesky 50-Sma
►Featured Trade Ideas
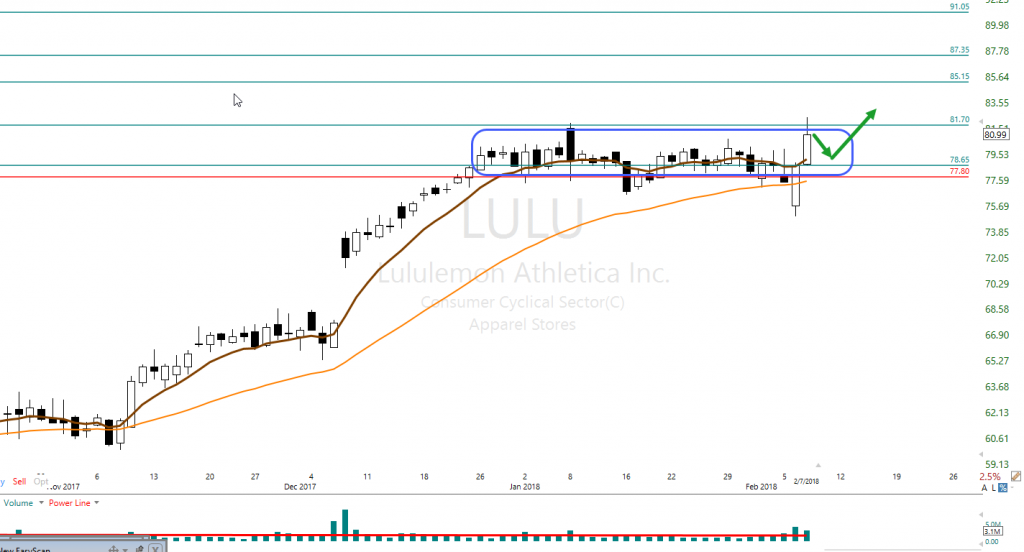
LULU printed a Bullish engulf two days ago and posted follow-through yesterday testing a multi-year high. LULU has the potential of reaching $100.00 or more. LULU has been trending and recently started to consolidate and has met a high number of our conditions for a possible trade. Learn more about how to trade this trade and others with Hit and Run Candlesticks starting at 9:10 ET in the live Trading Room #1
 [button_2 color=”blue” align=”center” href=”https://hitandruncandlesticks.com/hrc-rwo-30-day-offer/” new_window=”Y”]What would you spend to change your life?[/button_2]
►Learn the Power Of Simple Trading Techniques
On December 26, Rick shared WTW as a trade for members to consider and how to use the trading tools listed below. Currently, the profits could have been about 46% or $2345.00 with 100 shares. Using our Simple, Proven Swing Trade Tools and techniques to achieve swing trade profits.
Candlesticks • Price Action • T-Line • T-Line Bands • Support • Resistance • Trend • Trendlines • Chart Patterns • Buy Box • Volatility Stops • Profit Zones • Entry Zones • Protective Stops • RBB Rounded Bottom Breakout Strategy • Pop Out of The Box Strategy • Pinball Strategy • Trade Planning… Learn More
►The VXX short-term futures
The VXX is all over the place, the 200-SMA with a doji yesterday well above the downtrend line. While the VXX chart is in a bullish status, I do not believe it is not a buyable chart right now based on our terms.
►Rick’s Swing Trade ideas
Member Login – Full Trade List
30-Day Trial • Monthly • Quarterly • Semi-Annual • Annual
To learn more about our trading tools join us in the trading room or consider Private Coaching. Rick will help coach you to trading success.
Investing and Trading involve significant financial risk and is not suitable for everyone. No communication from Hit and Run Candlesticks Inc. is financial or trading advice. All information is intended for Educational Purposes Only. Terms of Service.
Rick Saddler is not a licensed financial adviser nor does he offer trade recommendations or advice to anyone except for the trading desk of Hit and Run Candlesticks Inc.
*************************************************************************************


Comments are closed.