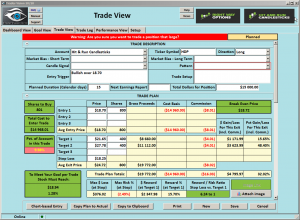
HDP – Exploded a Few Days Ago Engulfing
 HDP – Exploded a few days ago engulfing our big three moving averages and now consolidating. The T-Line has caught up, and the recent lows have tested the T-Line a couple of times. The trend has maintained its bullish direction with the 34-EMA pointing up. With a breakout out of $18.70, we see two swing profit zones. The study of price action can help determine when to sell, add or hold.
Good Trading – Hit and Run Candlesticks
► Members’ Trade Idea Update (ACLS)
With the ACLS trade, the profits are now about 22% or about $640, with 100 shares.
If you are interested in learning how to end the week with a profit that could change your life simply start a membership and learn what we have to share. – Yes I want the winning trades
► Eyes On The Market
I love using the T-Line to help determine the moving trend; I also love using the 2 and 3-day charts to filter through the noise. When I use the T-Line, and the 2 or 3-day charts price action and the trend become much more clear. Members know this for clarity. The point is; take a look at at the SPY chart on your computer using the T-Line and the 2 or 3-day chart.
Yes, the Bulls have sat down on the job, but there seems to be enough to keep price afloat. Above $256 the Bulls remain bullish with a normal pullback. Below $256 the 50-SMA will likely get challenged, and that might not be a good thing for the Bulls.
Rick’s trade ideas for the day – MEMBERS ONLY
30-Day Trial • Monthly • Quarterly • Semi-Annual • Annual
Investing and Trading involves significant financial risk and is not suitable for everyone. No communication from Hit and Run Candlesticks Inc. is financial or trading advice. All information is intended for Educational Purposes Only. Terms of Service.
Rick Saddler is not a licensed financial adviser nor does he offer trade recommendations or advice to anyone except for the trading desk of Hit and Run Candlesticks Inc.


Comments are closed.