
Last Updated: January 20, 2017
The three-card monte, three ghosts in A Christmas Carol, three-legged races, three-ring circuses, the Holy Trinity, the primary colors, the number of sides and corners in a triangle, three strikes before you’re out . . . we’ve already discussed the significance and prominence of the number three in our previous blog post, but it’s worth restating just how influential and common this numeral is. Whether three is your lucky number or not, we urge you to add the Falling Three Methods pattern to your Japanese candlestick repertoire. To learn what this signal looks like and what it means for the market, simply scroll down.
Falling Three Methods Pattern
Formation
The Falling Three Methods pattern includes five candles in total: two long and three short. If you think you’ve spotted this signal, look for the following criteria:
First, there must be one long black (or red) candle. Second, that first candle will be followed by three or more short white (or green) candles. Third, those three short candles must be contained within the first candle’s body, meaning their real bodies cannot reach above or below the first candle’s real body. Fourth, the short candles should be followed by another long black candle. Fifth and finally, the last candle must close below the first candle.
As you might have guessed, the Falling Three pattern typically follows a downtrend.
If you spot the opposite of this formation (a long white candle, three short black candles contained within it, and another long white candle that closes above the first), you’ve probably spotted the bullish form of this pattern: the Rising Three Methods pattern.
Meaning
As you can deduce from the downtrend and the long black candle at the start of the signal, the bears are dominating the bulls. However, after that, the price pauses for a moment (forming the three, short candles in the center, within the range of the first candle). The bulls aren’t able to push the price above the height of that first long candle, and they are overtaken by the bears. In the end, the price is driven downward again, creating another long black candle that closes below the first candle.
Examples
So what do you think? Do you have the Falling Three Methods pattern down pat? If you want to test your skills, use the examples below for help. These three charts can help you grasp what the pattern will look like in the real world, situated amongst dozens of other candles and signals. If you ignore the arrows and labels, you can evaluate your ability to locate the Falling Three Methods pattern and anticipate what will come next.
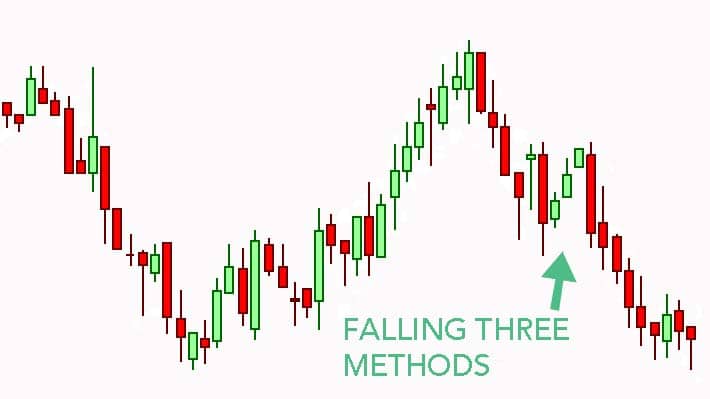
EXAMPLE 1:
In our first example, we start with a large, lumpy V of candles. Despite the hiccups, the bears dominate the first third of the chart, and the bulls control the second third. As the final third begins, the bears hold the reins and form a downtrend. However, during this downward progression, the bulls attempt a takeover. For three sessions, they manage to push the price up in small bursts. Despite their effort, the bulls can’t push the price above the preceding red candle. The next day, with the bears at the helm again, a long red candle forms and completes the Falling Three Methods pattern.
If you look closely, you can find a Rising Three Methods pattern within this chart as well. Take a gander. Do you see it? We’ll give you a hint: It appears before the Falling Three Methods. Need another hint? This elusive example doesn’t actually contain three “methods” – there are four candles in the middle, but one of those is just a doji. Have you spotted it? The Rising Three Methods occurs near the beginning of the uptrend and, as predicted, signals that the uptrend will continue.
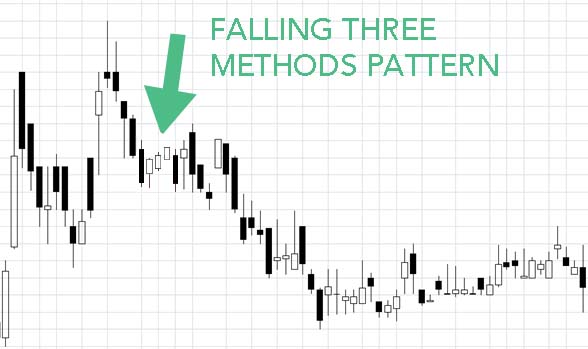
EXAMPLE 2:
Our second example begins with some monstrously large candles, both white and black. After a bit of floundering, the bears manage to take control of the price. A downtrend inevitably follows. However, the bulls refuse to sit back and let the bears have their way. For three price sessions, they fight back in a minuscule but noteworthy fashion. Ultimately, their effort fails; they can’t even bring the price above the high of the last bearish candle. Another bearish candle follows the three-candle uptrend, as anticipated, forming the Falling Three Methods pattern. A strong downtrend occurs after that, stretching to the chart’s midway point.
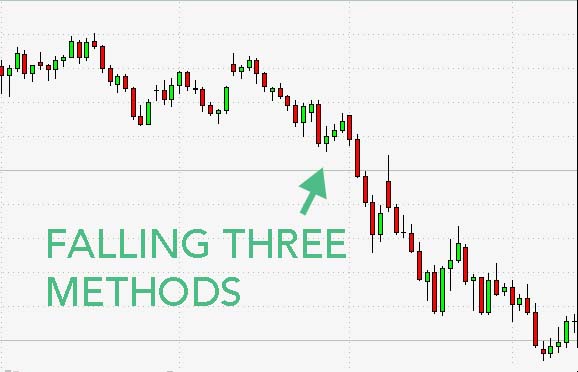
EXAMPLE 3:
If you’ll forgive our harshness, the bulls appear truly pathetic in this third example. In the midst of a downtrend, following a long red candle, they try to step up and take a stand. Although they succeed in forming three diminutive candles, they can barely bring the price halfway up the body of the preceding candle. Perhaps sensing their weakness, the bears take advantage of the situation and form four long red candles, the start of a downtrend that nearly reaches the end of the candlestick chart.
_____
Although three is thought by some to be a lucky number, you should never make assumptions when it comes to Japanese candlesticks. Before you make any big moves, relying on the message of a Falling Three Methods pattern, you need to get confirmation. To do this, all you need to do is check that the price trades below the body of the second long black candle.
That’s all there is to it! With a watchful eye and a bit of patience, you too can spot this bearish continuation pattern. Good luck!
If you’re interested in mastering some simple but effective swing trading strategies, check out Hit & Run Candlesticks. Our methods are simple, yet powerful. We look for stocks positioned to make an unusually large percentage move, using high percentage profit patterns as well as powerful Japanese Candlesticks. Our services include coaching with experienced swing traders, training clinics, and daily trading ideas. To sign up for a membership, please click here.


Comments are closed.