Rick’s Featured Trade Ideas
Today’s featured trade idea and my personal trade plan
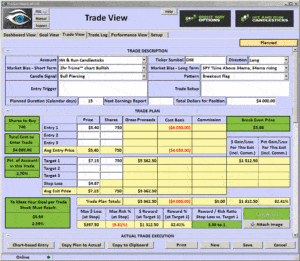
CHK | PBO Flag |Breakout | Piercing candle
 Good Morning, Profit Traders,
The T-Line™ is a powerful timing indicator
For nine days now, the SPY (market) has been In a consolidations box just waiting to break one way or the other. The $64,000 question is what direction is it going to break? Maybe the SPY (market) is waiting on FOMC meeting results. If so, we should know something today. Maybe the SPY (market) is waiting for earning reports before making a directional move.
Over the years I have learned to not fight the trend and price action despite what other indicators may be suggesting. As of the close yesterday, the trend remains bullish.
All the best to your trading success!
Rick | Hit and Run Candlestick Team
Trading knowledge ignites successful stock trading.
Continue Reading
Rick’s Featured Trade Ideas
Today’s featured trade idea and my personal trade plan
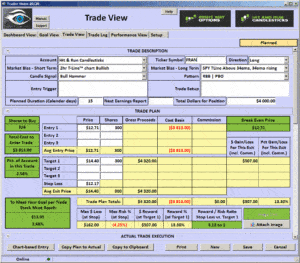
FRAN | RBB |T-Line™ Consolidation | Hammer
 Good Morning, Profit Traders,
Watch the T-Line™ The T-Line™ is a powerful timing indicator
This week is loaded with news and information that could give the market a boost to the upside or shove it off the ledge, so trade wisely and remember why we’re trading. Although the major indices are still closing above the T-Line™, I am starting to see a possible crack appear. The crack may be nothing more than good old-fashioned profit taking followed by the resumption of the bullish trend.
The DIA has painted a chart that looks extremely suspicious, an evening star last week that appears to be holding water. A week ago, the SPY printed a bearish engulf that continues to have a say in what price is doing for the past few days. There are few indicators that I peek at some evenings and every weekend, and last night I took a peek at the following indicators for the overall market: T2122, MACD, TSV, OBV, price action and what’s oil up to. My conclusion is simple. Unless there is positive news that comes from the FOMC meeting and/or really good earnings reports, I believe that we are positioned for a profit-taking pull back.
All the best to your trading success!
Rick | Hit and Run Candlestick Team
Trading knowledge ignites successful stock trading.
Continue Reading
Rick’s Featured Trade Ideas
Today’s featured trade idea and my personal trade plan
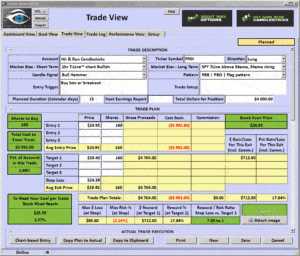
FRGI | RBB |PBO – Flag | T-Line™ Run Trend
SPY: T-Line™ Chart | Bullish
 Good Morning, Profit Traders,
For the past 16 trading days, the SPY and the T-Line™ have worked together to create a beautiful T-Line™ run, and consolidation started to occur on July 14 with a bearish engulf. The bulls were able to stop any bearish follow-through and hold their place until the T-Line™ caught up. The Bulls ended the week on a positive note, closing above $217.00 clearing the way for the next bullish leg getting ready to break out.
If the bulls are able to win the $218.50 flag, $221.60 would be next.
FOMC, Bank of Japan, BOJ and earnings. This is a busy week, could be good, could be bad. Follow the charts, stick with the basics and trade what you’re comfortable with.
All the best to your trading success!
Rick | Hit and Run Candlestick Team
Trading knowledge ignites successful stock trading.
Continue Reading
Rick’s Featured Trade Ideas
Today’s featured trade idea and my personal trade plan
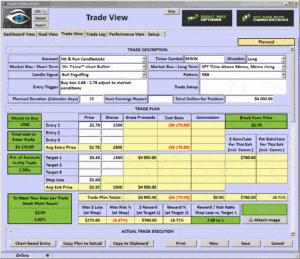
MWW | RBB |PBO – Bullish Engulf | J-Hook continuation pattern setting up
SPY: T-Line™ & 34ema 1-hour chart watching closely
Here is what one of our members had to say yesterday: “Rick, just wanted to say thanks. This month I have had 3 wins and 3 losses, but the losses were very small and only 1/4 of the wins. First profits in months. I listen and note what you say and trade the plan. Yes, still making some mistakes, but really learning!”
-Mary V.
 Good Morning, Profit Traders,
We have looked at $215.35 as support for a few days, and now that the T-Line has caught up, we will be using a combination of $215.35 and the T-Line to determine whether the Bulls or the bears are in charge of the market swing-trade direction.
Yesterday, the SPY closed down .38% forming a possible evening star signal. On a longer-term chart such as the weekly chart, you can see a possible Doji continuation pattern being built. Bottom line, we have resistance at about $217.05 and support at $215.35, and until we break out or break down with confirmation, we will continue to trade exactly the way we are, predominantly long and taking profits into strength.
All the best to your trading success!
Rick | Hit and Run Candlestick Team
Trading knowledge ignites successful stock trading.
Continue Reading
Rick’s Featured Trade Ideas
Today’s featured trade idea and my personal trade plan
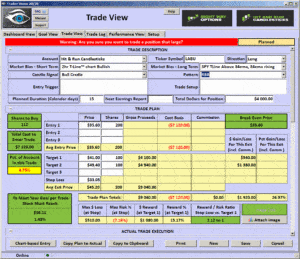
LABU | RBB |Bull Cradle
SPY: T-Line™ & 34ema bullish trend
 Good Morning, Profit Traders,
It would appear that we’re in for more of this slow grind with very minor dips and very minor pops. If the Bulls can manage to keep the SPY above $215.35, the Bulls bullish chart and run pattern will stay intact, but below $215.35, we could now see price below the T-Line™. Price below the T-Line™ could be setting us up for a bullish pullback as long as the pullback stays above $212.50.
I am starting to see a few intraday signs of laziness in the market. Let’s not forget, the bearish engulf on July 15 is still intact, and although the close yesterday was higher, it is higher without a great deal of confidence. If we do start to see weakness, there is an excellent chance we see a retest of the T-Line™.
All the best to your trading success!
Rick | Hit and Run Candlestick Team
Trading knowledge ignites successful stock trading.
Continue Reading
Rick’s Featured Trade Ideas
Today’s featured trade idea and my personal trade plan
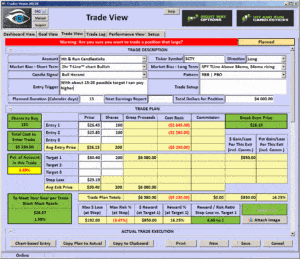
SCTY | RBB |Inside PBO | Bullish Harami | T-Line™ Trend Bullish
SPY: T-Line™ 34ema bullish trend | Market is very overbought
 Good Morning, Profit Traders,
SPY resistance — $217.01; support — $215.31.
Yesterday, the Bulls were not able to pass through the recent bearish engulf nor was the recent bearish engulf able to push the Bulls down. The battle will continue to unveil a winner, and when the winner is chosen then the battle will be to confirm success.
Overall, the Bulls continue to control this trend, and even a minor pullback would be a bullish pullback. Here at Hit-And-Run Candlesticks and Right Way Options, we continue to post bullish trades with positive results. Here are a few of yesterday’s results: APPS 12.28% | TDOC 9.10% | IMMR 8.13%
We continue to search out long and short trades for our subscribers, and we focus on strong chart patterns, price action (candlesticks signals), support and trade resistance, trade planning and common sense.
All the best to your trading success!
Rick | Hit and Run Candlestick Team
Trading knowledge ignites successful stock trading.
Continue Reading
Rick’s Featured Trade Ideas
Today’s featured trade idea and my personal trade plan
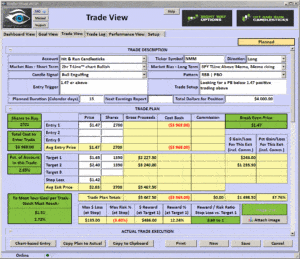
NMM | RBB |PBO Engulf | T-Line™ Trend Bullish
SPY: T-Line™ 34ema bullish trend | Market is very overbought
 Good Morning, Profit Traders,
The Bulls still control the SPY but there are signs that the bull is tired:
- The range has narrowed over the last couple weeks.
- The Doji bearish engulf is a warning sign not to take lightly.
- Yesterday’s close was outside of the narrowing trend.
We are predominantly long and still looking for long trade positions while the market may be entering a bullish pullback phase. The $212.50-ish (23.6% Fib retracement) pull back would be positive for the SPY chart. The $209-ish area would be something we will have to watch as it would be getting close to failing major support.
We are predominantly long and still looking for long trade positions while the market may be entering a bullish pullback phase.
The $212.50-ish (23.6% Fib retracement) pull back would be a positive bullish pull back for the SPY chart. The $209-ish area would be something we would have to watch as it would getting close to failing major support.
All the best to your trading success!
Rick | Hit and Run Candlestick Team
Trading knowledge ignites successful stock trading.
Continue Reading
Rick’s Featured Trade Ideas
Today’s featured trade idea and my personal trade plan
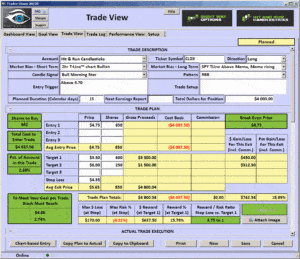
CLDX | Rising trend |RBB | Morning Star signal
SPY: T-Line™ 34ema bullish trend | Market is getting very overbought
 Good Morning, Profit Traders,
Did you know that on June 26, SGY was a members trade idea or how about GORO, CDE, EXK on June 16, could you have made money on these stocks?
Not to take anything away from the bulls; they have dominated the run from June 28th. Friday’s closing candle was a clear Bearish Engulf which is a major warning sign and suggests caution. In the next day or so, if we see selling follow-through below Friday’s low ($215.31), we might want to look at $212.50-ish to $209-ish as possible support areas; both numbers are Fibonacci lines.
The $212.50-ish (23.6% Fib retracement) pull back would be a positive bullish pull back for the SPY chart. The $209-ish area would be something we would have to watch as it would getting close to failing major support.
All the best to your trading success!
Rick | Hit and Run Candlestick Team
Trading knowledge ignites successful stock trading.
Continue Reading
Rick’s Featured Trade Ideas
Today’s featured trade idea and my personal trade plan
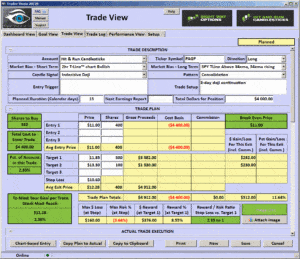
PAGP | Trending | 200-sma breakout | Doji Continuation
SPY: T-Line™ 34ema bullish trend | Market is getting very overbought
 Good Morning, Profit Traders,
Yesterday the SPY closed higher with a gap and a clear Doji and the trading range of the last 14 days has become extremely tight and narrow. The current chart pattern and yesterday’s Doji could lead to nothing more than minor consolidation and more bullishness.
If the Bulls lose 215.40 the bears should be able to pick up 212.40 Which would only be to the 23.6 fib line, a very healthy bullish pullback.
All the best to your trading success!
Rick | Hit and Run Candlestick Team
Trading knowledge ignites successful stock trading.
Continue Reading
Rick’s Featured Trade Ideas
Today’s featured trade idea and my personal trade plan
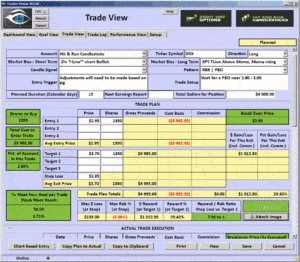
DSX | RBB | Bullish J-Hook Breakout
SPY: T-Line™ 34ema bullish trend | Market is getting very overbought
 Good Morning, Profit Traders,
Based on the open it would appear that the near dark cloud cover on IWM might not see weakness as follow through, of course the day is not completely over.
The morning futures seem to be suggesting that the Bulls are not willing to give up the race to the top. If the Bulls were to allow profits to be taken and it looks as if $212.00 down to $211.00 would be all the Bulls might give up.
You might want to draw from the June 24 high to yesterday’s high and then from the June 26 low to yesterday’s low you will see that there is a definite narrowing and tightening of range, this could be a warning sign of minor profit taking/consolidation.
All the best to your trading success!
Rick | Hit and Run Candlestick Team
Trading knowledge ignites successful stock trading.
Continue Reading


