Swing Trade Ideas July 12, 2016 HRC open webinar tonight 8pm EST

Rick’s Featured Trade Ideas
Today’s featured trade idea and my personal trade plan
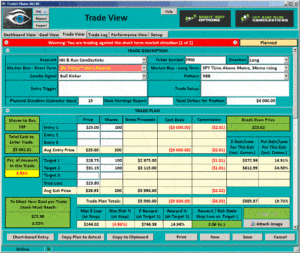
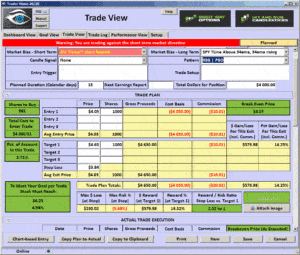
PRO| Bullish T-Line J-Hook
SPY:  T-Line™ T-Line is in a Bullish position with the 34-ema (profit taking setting up)
PRO 7-12-16Good Morning, Profit Traders,
Once again the Bulls demonstrated their strength in the SPY by closing at $213.40, higher than the previous close after a four-day run bouncing off the 50-day simple moving average with a Doji continuation pattern. Yesterday, the SPY ended up with a candlestick Shooting Star signal.  The Shooting Star signal I have found to be, at the very minimum, a warning sign.  Combine that with yesterday’s narrow range in light volume, and it might be prudent not to blow off the warning.  Price is also extremely overbought compared to the T-Line™, another warning sign that profit taking may be near, not to mention the four-week new high-low ratio is pegged in the overbought area.

Okay, enough of that talk.  Candlestick signals require confirmation, and as of yesterday’s close, there is no confirmation that the bears are taking any kind of control on the daily chart; although the 2-hour chart is showing a confirmed Shooting Star signal.  The trend is currently bullish with a strong possibility of a profit-taking pullback soon.

This week’s events – For more information Click Here

HRC Public webinar Tuesday July 12, 8pm EST
Trader Vision users group webinar Thursday July 14, 8pm CST
RWO Members Webinar Saturday July 16, 11am EST

All the best to your trading success!
Rick | Hit and Run Candlestick Team
Trading knowledge ignites successful stock trading.

Continue Reading

Swing Trade Ideas Monday July 11, 2016 Check out this weeks events

Rick’s Featured Trade Ideas

Today’s featured trade idea and my personal trade plan
LPSN | Bullish trend break |  Doji continuation pattern

SPY:  T-Line™ T-Line is in a Bullish position with the 34-ema

LPSN 7-11-16Good Morning, Profit Traders,

Last week the Bulls put together a beautiful bullish J-Hook Doji continuation pattern that closed Friday at $212.65 about a $1.15 from the all-time high.  The T-Line™ is now back above the 34 EMA for those that follow the T-Line™/34 EMA trend.

Last week the Bulls put together a beautiful bullish J-Hook Doji continuation pattern that closed Friday at $212.65, about a $1.15 from the all-time high.  The T-Line™ is now back above the 34 EMA for those that follow the T-Line™/34 EMA trend.

A successful Bull close over $213.80 would give us a bullish direction toward $214.90 followed by $217.65, with the typical chart dance up-PBO, up-PBO.  Judging by the emails I received from members, huge profits were made last week and the majority feel this week will be the same.  Success comes from planning, following your swing trade rules and selling into strength.

This week’s events – For more information Click Here
-Trader Vision 20/20 Workshop Monday July 11, 4pm EST
-HRC Public webinar Tuesday July 12, 8pm EST
-RWO Members Webinar Saturday July 16, 11am EST

All the best to your trading success!
Rick | Hit and Run Candlestick Team
Trading knowledge ignites successful stock trading.
Continue Reading

Public Swing Trade Ideas Thursday July 7, 2016

Rick’s Featured Trade Ideas

Today’s featured trade idea and my personal trade plan
DPM/Short | RBB Top |  H&S Top

SPY:  T-Line™ T-Line is in a Bearish position with the 34-ema

DPM 7-7-16Good Morning, Profit Traders,

The market has been perfect for the short-term swing trader (5 to 7 days) but not so much for the trader that is greedy or pushes the envelope or the longer-term trader.  Yesterday, the buyers were able to establish a low with a comeback Bullish Engulf.  The chart pattern for the last seven days has been a Bull Flag.  The question now, is there enough buyers to push us above the $209.88 resistance line?  After all, trends are all about follow-through and continuation.  In the trading world, we call this higher lows and higher highs if you’re looking for a bullish trend.  $207.50 is a number that I believe the buyers should defend.  If the sellers were to find themselves below $207.50, the bear may eat well.
All the best to your trading success!
Rick | Hit and Run Candlestick Team
Trading knowledge ignites successful stock trading.
Continue Reading

Swing Trade Ideas July 6, 2016

Rick’s Featured Trade Ideas

Today’s featured trade idea and my personal trade plan
GLBL/Long |RBB| Doji Continuation | T-Line™ Run

GLBL 7-6-16SPY:  T-Line™ T-Line is in a Bearish position with the 34-ema

Good Morning, Profit Traders,

Yesterday, July 5, the SPY lost a buck and a half dropping to its 23.6% Fibonacci retracement of its recent relief rally.   Yesterday morning, it looked as if price would find support around $207.85, as it did.  Today, $206.40 is looking like the magic number, but of course there’s no guarantee this acts as support.  On any given day we can find both long and short trades in a (big picture bullish or bearish market).  If we take a step back and take an honest look at the SPY and the way it has been forming (head and shoulder pattern), as well as other subtle failures, it would be easy to make the conclusion that the sellers are outnumbering the buyers.  With the weakness in the futures this morning, I’ll be watching to see if the SPY drifts to about $206.40.  Just like yesterday, until we see a reversal buy signal or pattern, trade cautiously.  Currently the market is not screaming bearish nor is it screaming bullish.

All the best to your trading success!
Rick | Hit and Run Candlestick Team
Trading knowledge ignites successful stock trading.

Continue Reading

Swing Trade Ideas Tuesday July 5, 2016 Members Only Webinar Tonight 8 pm EST

Rick’s Featured Trade Ideas

Today’s featured trade idea and my personal trade plan
CLDX/Long |RBB| Doji Continuation

CLDX 7-5-16SPY:  T-Line™ T-Line is in a Bearish position with the 34-ema

Good Morning, Profit Traders,

Most everyone was headed out for vacation on Friday, so the overall commitment to trade was lackluster.  The bulls were stopped at the sellers’ upper downtrend line drawn from June 8 to June 23 and extended downward to the July 1 high.  There are now three touches on this downtrend line when you include July 1.  (T-Line™ is also below the 34-ema. Last week was still a relief rally.)  The futures are suggesting a bit of profit taking this morning after the Bulls’ impressive relief rally last week, so a little pullback would be healthy.  $207.85 looks to be in a good pullback area followed by $206 40.  If the bears can manage to push the Bulls back down to $206 40 and the Bulls lose confidence at that level, the 200-period moving average may be the fallback.  Remember that price is king.  Let’s always follow price.  The relief rally last week was magnificent, and a pullback is likely but allow price to prove it —  a bare minimum, a positive.

All the best to your trading success!
Rick | Hit and Run Candlestick Team
Trading knowledge ignites successful stock trading.

Continue Reading

Swing Trade Ideas July 1, 2016

Rick’s Featured Trade Ideas

Today’s featured trade idea and my personal trade plan
BOOT/Long |RBB| Doji Continuation
SPY:  T-Line™ Chart Down | Price deep into resistance

BOOT 7-1-16Good Morning, Profit Traders,

I was wrong!  I never would’ve thought that the SPY would have gone from $198.55 to closing yesterday at $209 54 without at least a pausing pullback.  All this week I have  expected this relief rally to stop turn and head back down to at least find a higher low or a double bottom at the $198.55 level.  It just goes to show you, keep your emotions and your forecasting out of the charts.  Yes we have been approaching resistance and yes we are in resistance, but this week I did not follow my own advice….. FOLLOW PRICE ACTION, support and resistance is nothing unless price says it is.  For some I think I may have to eat my hat today.

Yesterday’s close was on a bullish candle just underneath a two touch downtrend line, we are very overbought and we are very much in a resistance area.  Let’s keep her eyes on the price watching the candlesticks for clues of more bullishness or selling.

All the best to your trading success!
Rick | Hit and Run Candlestick Team
Trading knowledge ignites successful stock trading.

Continue Reading

Swing Trade Ideas June 30-2016

Rick’s Featured Trade Ideas

Today’s featured trade idea and my personal trade plan
TWTR/Long |RBB| J-Hook| 4-day Engulf
SPY:  T-Line™ Chart Down | Price deep into resistance

Good Morning, Profit Traders,

TWTR 6-30-16$205.00 and $206.00 were both tagged briefly by two 30-minute bars.  From there, the Bulls were able to find another $.90.  On the 30-minute chart, the SPY is getting close to our high deuces which I’ll be discussing in the trading room today and the importance of where they are on the chart.  A successful close over the high deuces would be a smooth move for the Bulls.  Failure could produce a shorting opportunity.  Today I see a little support on the SPY at $205.85 and a little resistance starting at $207.95.

The US dollar index (DXYO) has pulled back to support and is flagging.  The question here is:  Will support help push it through the 200-period moving average, or will the 200-period moving average be more than it can handle?

Overall, the market has been damaged and will take quality construction to put the market back in contention with the highs.  It’s important to understand how bottoms are formed, how support needs to be tested and resistance needs to be broken down.  There’s a big difference between a reversal and a relief rally.  At this time, I only see a relief rally being attempted.

All the best to your trading success!
Rick | Hit and Run Candlestick Team
Trading knowledge ignites successful stock trading.

Continue Reading

Swing Trade Idea June 29, 2016 Trader Vision webinar June 30, 2016

Rick’s Featured Trade Ideas

Today’s featured trade idea and my personal trade plan
BPT/Long |RBB| Bullish Engulf | Breakout

BPT 6-22-16SPY:  T-Line™ Chart: A close is needed over $203.35

Good Morning, Profit Traders,

The oversold relief rally continues according to the morning futures.  Yesterday, the two numbers we posted, $202.15 and $203.35, were spot on.  The morning futures fueling the relief rally puts a nice round number of $205.00 in the crosshairs for resistance followed by $206.00.
The transports remain in horrible shape with price of the weekly chart still under the 200- period moving average.

The US dollar index (DXYO) closed yesterday at $96.09, the 200-period moving average has held off the last three attempts to push through, and $95.50 is acting as support.

Overall, the market has been damaged and will take quality construction to put the market back in contention with the highs.  It’s important to understand how bottoms are formed, how support needs to be tested and resistance needs to be broken down.  There’s a big difference between a reversal and a relief rally.  At this time, I only see a relief rally being attempted.

All the best to your trading success!
Rick | Hit and Run Candlestick Team
Trading knowledge ignites successful stock trading.
Continue Reading

Swing Trade Ideas June 28, 2016 Public Webinar/Workshop Tonight

June 28 | 5pm PST | 7pm CST | 8pm EST

Rick Saddler | HRC Public e-Learning

Link: http://hitandruncandlesticks.omnovia.com/room1
Password: No Password Required

Rick’s Featured Trade Ideas

Today’s featured trade idea and my personal trade plan
S/Long |T-Line™ PBO| Higher Highs and Higher Lows
S 6-28-16
SPY:  T-Line™ Chart: A close in needed over $202.20

Good Morning, Profit Traders,

Europe is trying to bounce back but volatility remains, and today we start the relief rally phase.  The SPY is set up to open higher kicking off the relief rally from a very bruised and oversold market.  It’s not the open or the midday that will be the most important hour of the day; it’s the close.  The question is:  Will we close over $200.20, the first resistance at yesterday’s close?  Today, will it act as support after the morning positive relief?   $202.15 and $203.35 will be important resistance numbers that the relief rally will have to deal with.
There should be some pretty decent trades today, but I don’t believe this relief rally will continue without constructing a bottom formation.
The $199.00 area clearly acted as support yesterday as noted in our June 27 morning note.

All the best to your trading success!
Rick | Hit and Run Candlestick Team
Trading knowledge ignites successful stock trading.

Continue Reading

Swing Trade Ideas June 27, 2016 RWO Live Trading Room Kick Off July 1, 2016

Rick’s Featured Trade Ideas

Today’s featured trade idea and my personal trade plan
ABX/Long |J-Hook PBO| Higher Highs and Higher Lows

ABX 6-27-16SPY:  T-Line™ Chart: Below 202.85 will hurt

Good Morning, Profit Traders,

The volatility should be with us for a while, but once the market has had time to absorb the recent Brexit information, it should be easier to trade.  I believe there is more downside to come with relief rallies along the way.  Timing the market and your charts are more important now than we have seen in a long time.  It’s a good thing that we have been talking about support and resistance so much lately.  The SPY looks like $199.00 could see a little support while $206.00 may offer a little resistance.  At the close on Friday, Gold, Silver, Utilities and Real Estate seem to be in the best shape.  Utilities are overbought.

Overall, this is a very heavy market right now with a great deal of fear because of the unknown.

All the best to your trading success!
Rick | Hit and Run Candlestick Team
Trading knowledge ignites successful stock trading.
Continue Reading