Rick’s Featured Trade Ideas
Today’s featured trade idea and my personal trade plan
No featured trade idea today
Good Morning, Profit Traders,
The T-Line™ is a powerful timing indicator
It’s all about the jobs report and how it is perceived. Yesterday, the SPY closed over the T-Line™ with a long lower wick suggesting the bulls may have decided to stop and take advantage of the bullish pullback. Below $215.25, the bulls lost interest and above $217.25 the Bears are in trouble. To really get this market moving, the DIA’s will have to close above $184.85.
All the best to your trading success!
Rick | Hit and Run Candlestick Team
Trading knowledge ignites successful stock trading.
Continue Reading
Rick’s Featured Trade Ideas
Today’s featured trade idea and my personal trade plan
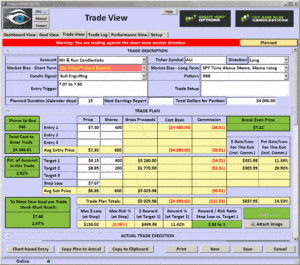
ALJ | RBB| Bullish Engulf | PBO bullish J-Hook
 Good Morning, Profit Traders,
The T-Line™ is a powerful timing indicator
On the daily chart the SPY formed a Bullish Harami above yesterday’s low unfortunately it did not close back above the T-Line™ as always candlestick signals must confirm but then again that’s true with price in general not just Candlesticks. If you look at yesterday’s Harami on an intraday chart (I am looking at a 1-hour and 2-hour chart) you can see a bear flag forming, this is why you need confirmation on the daily chart.
Be aware of QE from the Bank of England today and job numbers tomorrow, we should be prepared for anything in the market. Keep the watch lists for both long and short updated and handy.
All the best to your trading success!
Rick | Hit and Run Candlestick Team
Trading knowledge ignites successful stock trading.
Continue Reading
Rick’s Featured Trade Ideas
Today’s featured trade idea and my personal trade plan
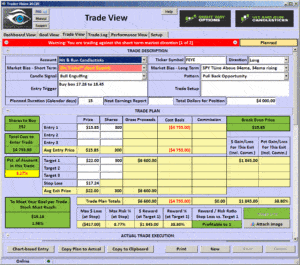
FEYE | PBO| Bullish Engulf
 Good Morning, Profit Traders,
The T-Line™ is a powerful timing indicator
The SPY has moved below the T-Line™ along with DIA, IWM, IYT and SMH. This is signaling the sellers are wanting there piece of the pie. Over all, the market is still bullish as long as we hold above support. The
profit taking pullback in the SPY, IWM, DIA is either testing the 23.6 Fib retracement (a bullish PBO so far). Friday’s job numbers may give the market a nudge one way or the other.
All the best to your trading success!
Rick | Hit and Run Candlestick Team
Trading knowledge ignites successful stock trading.
Continue Reading
Rick’s Featured Trade Ideas
Today’s featured trade idea and my personal trade plan
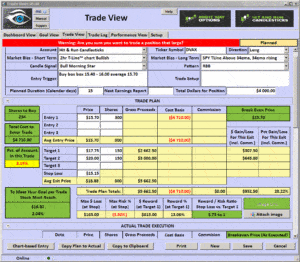
DVAX | RBB |Morning Star |
 Good Morning, Profit Traders,
The T-Line™ is a powerful timing indicator
Bottom Line, this is a very boring market! DIA’s are a little closer to a possible support level; the SPY, IWM and the QQQ’s remain above the T-Line™. The QQQ’s produced a very concerning high wick yesterday.
Keep in mind, this is only the 30-min chart. I am seeing a slight crack in my 30-min chart on the SPY and IWM, the DIA’s cracked a few days ago. The QQQ’s, depending on how they close today, could also show signs of cracking.
The Bulls/Buyers still have the upper hand, and a minor pullback may offer a buying opportunity. We will be watching support for buying opportunities or weakness.
All the best to your trading success!
Rick | Hit and Run Candlestick Team
Trading knowledge ignites successful stock trading.
Continue Reading
Rick’s Featured Trade Ideas
Today’s featured trade idea and my personal trade plan
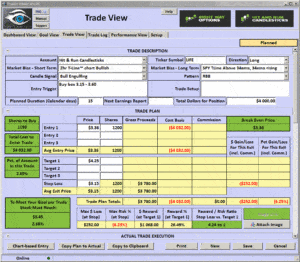
LIFE | RBB |Buy box 3.15 – 3.60
 Good Morning, Profit Traders,
The T-Line™ is a powerful timing indicator
**** Password change for the Trading Rooms*****
The SPY and QQQs remain in bullish territory with price leading the T-Line™, and the DIAs are still in bullish territory while fighting the T-Line™ in a mild pullback. If the SPY cracks $215.50, a support test at $213.40 will likely follow. We remain bullish and very cautious at the same time with oil falling and 20-year treasury bonds rising.
All the best to your trading success!
Rick | Hit and Run Candlestick Team
Trading knowledge ignites successful stock trading.
Continue Reading
Rick’s Featured Trade Ideas
Today’s featured trade idea and my personal trade plan
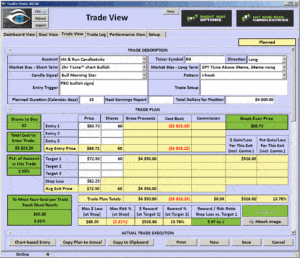
BG | PBO buy box 62.25 and 65.67 |J-Hook continuation | Morning Star
 Good Morning, Profit Traders,
The T-Line™ is a powerful timing indicator
The DIA’s are desperately searching for footing so they can call it support, closing below the T-Line™ yesterday and creating another lower low. The morning futures at the moment suggest an open below the T-Line™. The QQQ’s are strong while IWM and the SPY are a bit flat. SMH is a huge leader while IYT struggles. There are only three directions the market can go: up, down or sideways. When the market moves sideways, swing traders become frustrated and impatient and can lead to mistakes like forcing a trade because you feel like you have to put a trade on. Don’t worry; the market will find a direction.
All the best to your trading success!
Rick | Hit and Run Candlestick Team
Trading knowledge ignites successful stock trading.
Continue Reading
Rick’s Featured Trade Ideas
Today’s featured trade idea and my personal trade plan
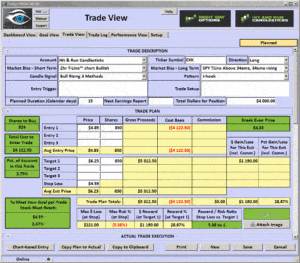
EXK | J-Hook |T-Line™ POP |
 Good Morning, Profit Traders,
The T-Line™ is a powerful timing indicator
Janet Yellin had nothing to say that moved the market one way or the other, to speak of. Facebook earnings were positive, and the overall market basically floats along sideways. IWM showed healthy signs of bullishness closing the last two days above the breakout line while the DIA continues to nurse a bum leg.
Six days ago, DIA presented us with a evening star and that evening star has kept the Bulls working overtime keeping price held above water. The 1-hour chart of the Dow Jones industrial average ETF is showing signs of weakening and a small crack in the chart. Of course, it’s just the 1-hour chart and it simply offers a clue.
For now, the overall stock market remains bullish, and the Bulls continue to dominate.
All the best to your trading success!
Rick | Hit and Run Candlestick Team
Trading knowledge ignites successful stock trading.
Continue Reading
Rick’s Featured Trade Ideas
Today’s featured trade idea and my personal trade plan
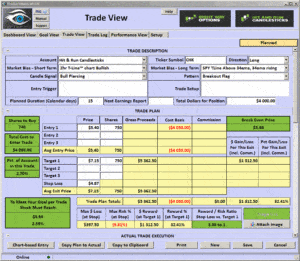
CHK | PBO Flag |Breakout | Piercing candle
 Good Morning, Profit Traders,
The T-Line™ is a powerful timing indicator
For nine days now, the SPY (market) has been In a consolidations box just waiting to break one way or the other. The $64,000 question is what direction is it going to break? Maybe the SPY (market) is waiting on FOMC meeting results. If so, we should know something today. Maybe the SPY (market) is waiting for earning reports before making a directional move.
Over the years I have learned to not fight the trend and price action despite what other indicators may be suggesting. As of the close yesterday, the trend remains bullish.
All the best to your trading success!
Rick | Hit and Run Candlestick Team
Trading knowledge ignites successful stock trading.
Continue Reading
Rick’s Featured Trade Ideas
Today’s featured trade idea and my personal trade plan
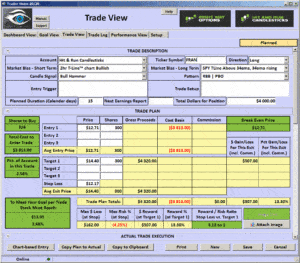
FRAN | RBB |T-Line™ Consolidation | Hammer
 Good Morning, Profit Traders,
Watch the T-Line™ The T-Line™ is a powerful timing indicator
This week is loaded with news and information that could give the market a boost to the upside or shove it off the ledge, so trade wisely and remember why we’re trading. Although the major indices are still closing above the T-Line™, I am starting to see a possible crack appear. The crack may be nothing more than good old-fashioned profit taking followed by the resumption of the bullish trend.
The DIA has painted a chart that looks extremely suspicious, an evening star last week that appears to be holding water. A week ago, the SPY printed a bearish engulf that continues to have a say in what price is doing for the past few days. There are few indicators that I peek at some evenings and every weekend, and last night I took a peek at the following indicators for the overall market: T2122, MACD, TSV, OBV, price action and what’s oil up to. My conclusion is simple. Unless there is positive news that comes from the FOMC meeting and/or really good earnings reports, I believe that we are positioned for a profit-taking pull back.
All the best to your trading success!
Rick | Hit and Run Candlestick Team
Trading knowledge ignites successful stock trading.
Continue Reading
Rick’s Featured Trade Ideas
Today’s featured trade idea and my personal trade plan
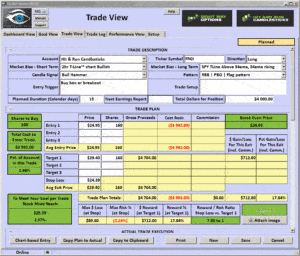
FRGI | RBB |PBO – Flag | T-Line™ Run Trend
SPY: T-Line™ Chart | Bullish
 Good Morning, Profit Traders,
For the past 16 trading days, the SPY and the T-Line™ have worked together to create a beautiful T-Line™ run, and consolidation started to occur on July 14 with a bearish engulf. The bulls were able to stop any bearish follow-through and hold their place until the T-Line™ caught up. The Bulls ended the week on a positive note, closing above $217.00 clearing the way for the next bullish leg getting ready to break out.
If the bulls are able to win the $218.50 flag, $221.60 would be next.
FOMC, Bank of Japan, BOJ and earnings. This is a busy week, could be good, could be bad. Follow the charts, stick with the basics and trade what you’re comfortable with.
All the best to your trading success!
Rick | Hit and Run Candlestick Team
Trading knowledge ignites successful stock trading.
Continue Reading


