Rick’s Featured Trade Ideas
Today’s featured trade idea and my personal trade plan
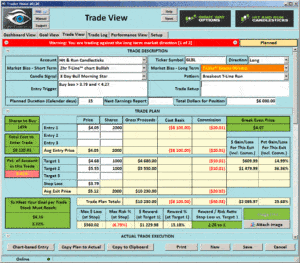
GLBL Long | Breakout
Double click the trade plan to enlarge
 Good Morning, Profit Traders,
After yesterday’s gap, the story was pretty boring. All of the yesterday’s move was in the gap leaving the rest of the day to do whatever you do.
The SPY did close over our $216.80 line, just not as strong as I would have liked. A proper pullback can be very bullish, (we will talk about this in the trading room today, if not proper not so good for the bulls.)
This past week was fantastic for our members, HRC and RWO.
AEGR (RBB Pattern) broke out and ran 52% with the help of a Doji continuation pattern. CRMD (RBB Pattern) jumped the 200-sma for about 60%. PTCT (RBB Pattern) found the T-Line™ and didn’t let go. CLVS (RBB Pattern) after completing the RBB Pattern +45% CLVS jumped the 200-sma for another 73%. CONN (RBB Pattern) and T-Line™ Run 65%
Tell me again why you are not a member?
We offer affordable membership and private coaching. Take the next step Click Here
Rick & Hit and Run Candlestick Team
Members Daily Trade Ideas. Be aware of sudden market changes!
This list is reserved for subscribed members
These are the stocks I put on my watch list to trade. I focus on these stocks for Swing Trades and the potential 10% – 40% gains. You must follow your trading rules for entry stops, profits or losses. Remember to check for earnings!
Keep your eye on the inverse ETF’s They trade well!
Continue Reading
Rick’s Featured Trade Ideas
Today’s featured trade idea and my personal trade plan
GLBL Long | Breakout
Double click the trade plan to enlarge
 Good Morning, Profit Traders,
After yesterday’s gap, the story was pretty boring. All of the yesterday’s move was in the gap leaving the rest of the day to do whatever you do.
The SPY did close over our $216.80 line, just not as strong as I would have liked. A proper pullback can be very bullish, (we will talk about this in the trading room today, if not proper not so good for the bulls.)
This past week was fantastic for our members, HRC and RWO.
AEGR (RBB Pattern) broke out and ran 52% with the help of a Doji continuation pattern. CRMD (RBB Pattern) jumped the 200-sma for about 60%. PTCT (RBB Pattern) found the T-Line™ and didn’t let go. CLVS (RBB Pattern) after completing the RBB Pattern +45% CLVS jumped the 200-sma for another 73%. CONN (RBB Pattern) and T-Line™ Run 65%
Thank you for being a member and making HRC so great!
Rick & Hit and Run Candlestick Team
Members Daily Trade Ideas. Be aware of sudden market changes!
This list is reserved for subscribed members
MRTX
NM
GLBL
TWOU
NVGS
PRGO
PZZA
FIT
GKOS
TTMI
NUS
ETSY
These are the stocks I put on my watch list to trade. I focus on these stocks for Swing Trades and the potential 10% – 40% gains. You must follow your trading rules for entry stops, profits or losses. Remember to check for earnings!
Keep your eye on the inverse ETF’s They trade well!
Continue Reading
Good morning. Now that we are past all big news maybe we can get back to some trading. I would lover to say back up the truck and start loading up on stock but when you look at the overhead resistance that would be a foolish thing to do. There is no question that market looked bullish at the end of trading yesterday however it is also undeniable that resistance has been a major player in the market indexes and should not be ignored.
As with any big move, follow-through is essential and it is not required to do so immediately. We must continue to plan trade carefully and keep ourselves focused on the overall chart, not a single day.
That being said there are a lot of nice looking charts and you should expect to see some trade alerts coming out today.
Trade Wisely,
Doug
Click Here to Watch Video
Rick’s Featured Trade Ideas
Today’s featured trade idea and my personal trade plan
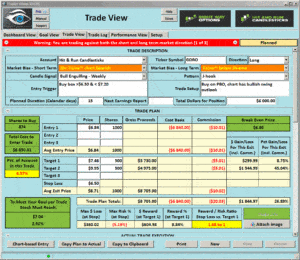
GORO Long | Broke over resistance, Weekly J-Hook Pattern
Double click Trade View to enlarge
 Good Morning, Profit Traders,
Want to hang out with some of the best traders in the world?
Want to learn how the best, the highest probable trades? Did you know you don’t have to be in the trading room to learn and bank profits? Below are a few trades that have been on our news board.
CONN +23.75%
PTCT +33.86%
CMRD +53.49%
BLOX +22.79%
OVAS +32%
We offer affordable membership and private coaching. Take the next step Click Here
No rate hike! If history repeats itself and it should, the bulls should be feeling pretty good. Price has closed over the important $215.55 area and will try to take on the $216.80 area, which is another resistance area that the bulls needs to win. The 3-day chart is forming a Bullish Morning Star signal and with follow-through, over $216.80 could set the bulls free to print new highs.
Rick & Hit and Run Candlestick Team
Members Daily Trade Ideas. Be aware of sudden market changes!
This list is reserved for subscribed members
These are the stocks I put on my watch list to trade. I focus on these stocks for Swing Trades and the potential 10% – 40% gains. You must follow your trading rules for entry stops, profits or losses. Remember to check for earnings!
Keep your eye on the inverse ETF’s They trade well!
Continue Reading
Rick’s Featured Trade Ideas
Today’s featured trade idea and my personal trade plan
GORO Long | Broke over resistance, Weekly J-Hook Pattern
Double click Trade View to enlarge
 Good Morning, Profit Traders,
Want to hang out with some of the best traders in the world?
Want to learn how the best, the highest probable trades? Did you know you don’t have to be in the trading room to learn and bank profits? Below are a few trades that have been on our news board.
CONN +23.75%
PTCT +33.86%
CMRD +53.49%
BLOX +22.79%
OVAS +32%
We offer affordable membership and private coaching. Take the next step Click Here
No rate hike! If history repeats itself and it should, the bulls should be feeling pretty good. Price has closed over the important $215.55 area and will try to take on the $216.80 area, which is another resistance area that the bulls needs to win. The 3-day chart is forming a Bullish Morning Star signal and with follow-through, over $216.80 could set the bulls free to print new highs.
Rick & Hit and Run Candlestick Team
Members Daily Trade Ideas. Be aware of sudden market changes!
This list is reserved for subscribed members
GORO
ETSY
BRS
FET
NUS
GPRO
PTCT
FIT
PRGO
LC
AEGR
These are the stocks I put on my watch list to trade. I focus on these stocks for Swing Trades and the potential 10% – 40% gains. You must follow your trading rules for entry stops, profits or losses. Remember to check for earnings!
Keep your eye on the inverse ETF’s They trade well!
Continue Reading
Last Updated: September 21, 2016
Imagine a mountain engulfed in flames. What a sight that would be! When I picture a Bearish Engulfing pattern, I think of that imaginary mountain. There are prices rising upward, creating one half of the mountain, a black candlestick engulfing a white candlestick at the top, and then the inevitable downward movement creating the other half of the mountain. This bearish candlestick pattern is important for investors to know, and luckily it’s easy to identify and interpret. We’ve already discussed its bullish brother, the Bullish Engulfing pattern, so today it’s time we gave the Bear its turn.
Continue Reading
Good morning. It’s Yellen day and without question, it is going to be a tough day to trade. The BOJ did just enough to keep the bears from showing their teeth this morning but let’s keep in mind the market has now gapped up 4 days in a row only to sell off the rest of the day. Fool me once shame on you, fool me twice, Shame on Me!
At 10:30 eastern time will get oil numbers and that has proven to move the market in the past. At 2 PM we will finally hear from the Fed with the press conference at 2:30. Expect some very wild price action right after the news with some very big whipsaws in just a few minutes.
I will likely sit on my hands most of the day if not all. Trading the news is the domain of the big boys so it’s better to stand aside and let them duke it out. We will enter after it calms down and a directional decision has been made.
Trade Wisely,
Doug
Click here to watch the video.
Learn from example | $CARA | Video Replay
When I hear the word engulfing, I imagine a wave washing over a shore or a building being consumed by flames. To engulf means to sweep over something, to surround it, or to cover it completely. Thus, it should come as no surprise that a Bullish Engulfing pattern features one candlestick covering (or engulfing) another. This two candlestick pattern occurs after a downtrend and is formed by one bearish candlestick (which is covered) and one bullish candlestick (which does the covering). It occurs frequently, so it is important that you learn to identify and interpret it. Ready for a quick lesson? To learn more about the Bullish Engulfing pattern’s formation and meaning, simply scroll down.
Continue Reading


