The SPY is Painting a Bullish W Pattern on the 3-Day Chart
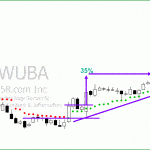
With the help of the French election the SPY is painting a Bullish W Pattern (clearly seen on the 3-day chart), follow through is needed. Yesterday price also closed over the 50-SMA and the upper T-Line Band. And the closing price $237.17 in also back above the cloud.
The battle is not over; A bull-Bear winner has not stepped forward.
FREE Trade Idea – SEDG
SEDG – A Rounded Bottom Breakout Strategy, broke out above the 200-SMA setting up for a Bullish J-Hook Breakout. 3-day chart pictures a beautiful Morning Star that launch price back above the upper T-Line Band.
[button_1 text=”2-Hours%20of%20Private%20Coaching%20Can%20Change%20the%20Rest%20of%20YOUR%20LIFE” text_size=”32″ text_color=”#000000″ text_bold=”Y” text_letter_spacing=”0″ subtext_panel=”N” text_shadow_panel=”N” styling_width=”40″ styling_height=”30″ styling_border_color=”#000000″ styling_border_size=”1″ styling_border_radius=”6″ styling_border_opacity=”100″ styling_shine=”Y” styling_gradient_start_color=”#ffff00″ styling_gradient_end_color=”#ffa035″ drop_shadow_panel=”N” inset_shadow_panel=”N” align=”center” href=”https://hitandruncandlesticks.com/private-personal-coaching-right-from-the-pros/” new_window=”Y”/]
Charts to Learn From – IMGN
IMGN – Following my post to our subscribers that IMGN was likely to move higher in the coming weeks, it moved 97% higher and is now showing signs of even moving higher from its current breakout. Note the Doji Continuation Pattern
Investing and Trading involve significant financial risk and is not suitable for everyone. No communication from Hit and Run Candlesticks Inc. is not financial or trading advice. All information is intended for Educational Purposes Only. Terms of Service
Members Trade Ideas Below
Members trade ideas below reserved for subscribed members
Scanned from Tc2000 | 10-15 trade ideas daily
What is a Trade Idea Watch List?
A trade idea watch list is a list of stocks that we feel will move in our desired direction over a swing trader’s time frame. That time could be one to 30 days for example.
From that watchlist, we wait until price action meets our conditions for a trade.
© 2007 – 2017 Hit & Run Candlesticks INC. – Right Way Options – Strategic Swing Trade Service – Trader Vision – All Rights Reserved. Terms of Service Investing and Trading involves significant financial risk and is not suitable for everyone. No communication from Rick Saddler, Doug
Beware the Green Eyed Monster!
The Green Eyed Monster of Envy can destroy your trading! Last night I was talking with a fellow trader that was very disappointed with their trading. As we progressed through the conversation, it became clear that his disappointment and frustration was self-inflicted. Although he had turned the corner from a consistently losing trader to a net winning trader, it was not enough. Like all of us, he wanted more.
As a very competitive person he was comparing himself to other traders and the results they were posting. Envy was destroying his success! He was ready to quit trading because of the frustration even through his account was growing. Although we all work to help each other improve as traders in the trading room, trading is a single person activity. We all start from a different place, and we all have different goals. Comparing yourself to another trader is like comparing apples and oranges.
A trader must compete with themselves not others. Your goal should be to see improvement in yourself and your trading account. A good place to start is by setting small achievable goals for each week or each month. Record your results. If you only made $10 last month that is a Huge Improvement if you have been a losing trader! If in the next month you see a gain of $15 that’s a 50% improvement over the prior month. Small incremental improvements build confidence and over time builds big accounts.
On the Calendar
Today on the Economic Calendar we have the Case-Shiller numbers at 9:00 AM Eastern followed by New Home Sales and Consumer Confidence at 10:00. Although they are all important, the big number of the day is the New Home Sales and the one most likely to move the market. Earnings are starting to ramp up with 190 companies reporting today. Keep checking!
Action Plan
Futures remained positive all night and continued to push higher in the premarket as earnings roll out. How great it will be to have a follow through day after all the choppiness of the last couple months! I will be looking for new trades today. However, I will be watchful for signs of a pullback to test support because it could happen at any time. Yesterday was saw the Dow close up more than 200 points. It would not be out of the question to see some profit taking.
[button_2 color=”green” align=”center” href=”https://hitandruncandlesticks.sharefile.com/d-s2528e250a954a05b”]Morning Market Prep Video[/button_2]
Trade Wisely,
Doug
SWKS Option Trade of the Week | Video Reply
-
- Trade Alert issued on February 17, 2017.
- Trade Exit occurred on the afternoon of April 24, 2017.
- Pop-Out-Of-The-Box-Pattern with a Bull Call Debit Spread.
- 78.76% Gain = Approximately $564 per spread.
30-Day Trial | Hit & Run Candlesticks or Right Way Options
Investing and Trading involves significant financial risk and is not suitable for everyone. No communication from Hit and Run Candlesticks or it’s associates should be considered as financial or trading advice. All information is intended for Educational Purposes Only. Terms of Service
Cup and Handle Formation-Bullish Continuation Pattern
The “cup and handle formation” is a bullish signal pointing to a continuation of the current trend. It may extend over several weeks or even months and contains specific attributes.
As with any continuation pattern, you rely on a confirmation in one form or another. This may occur as a second technical price signal, a candlestick continuation, volume spike, or change in momentum.
There are several parts to the cup and handle. First is the cup, which is a rounded bottom extending over time. As the shape of the cup is completed, expect the handle to emerge. This is a swing trade in the opposite direction, characterized by a specific channel between resistance and support, forming as a pennant or similar channel movement and, quite often, separated from the “cup” with an upside gap. As the handle declines and concludes, price reverses, moving again to the upside and setting up as a breakout from previous resistance.
The Cup Depth
Cup depth should represent retracement of about one-third of the prior advance at the most. In some especially volatile cases, retracement could also be much greater, so the one-third guidance is not an absolute requirement.
The Handle
Handle should be understood as a consolidating offset against the bullish movement in the greater scheme of price behavior. As a pullback, the handle is a short-term aspect of the pattern. Because it is a retracement, the caveat for all retracements applies here. Expect a relatively short-term period of time in order to predict a strong continuation of the bullish trend.
At this point – the conclusion of the three phases (cup, handle, breakout), look for confirmation in the form of a bullish continuation signal. While this may develop as an ascending triangle, it is more likely to appear as one of many bullish candlestick continuation signals. This confirms the cup and handle as the initial bullish indicator.
Some chartists like to set price targets following the cup and handle, based on duration of the pattern, degree of price movement, and strength of the subsequent continuation. However, as an initial effort, recognizing the pattern is essential for identifying and then confirming its value in predicting price direction.
The initial bullish trend moved price from $61.75 to resistance of $63.75 in approximately a two-week period. At that point, the rounded bottom of the cup began to form. It lasted approximately 1 ½ months.
The handle formed after a strong upward gap and formation of a short-term bearish island cluster of two sessions (defined as movement away from price range with gaps on both sides). The handle moved price from $64.50 down to $62.50 over less than one week.
A breakout followed, moving price above resistance of $63.75. The bullish continuation initiated by the cup and handle was confirmed at the point of breakout by a thrusting lines candlestick, a bullish continuation. The ensuing bullish trend, marked by the trendline, continued into March, when a retracement appeared. This was followed immediately by another bullish thrusting lines pattern, indicating that the bullish trend was not ending.
Every cup and handle is slightly unique, so do not expect the exact configuration to occur in every case. So much depends on volume and volatility in effect at the moment. Economic and fundamental news (or rumor) also determine how acute the rounded bottom of the cup will be, and how long the handle will ensure.
Can the cup and handle fail or turn out as a false signal? Yes. All reversal and continuation patterns are indications only, and cannot ever lead to 100% confidence. However, as with all strong signals, reliance on the initial pattern and confirmation improves your chances for a successful timing of entry and exit and overall improvement in chart reading capabilities.
To learn more about the cup and handle in its many forms, go to Bullish Cup and Handle Pattern for an e-book on the topic. This e-book provides an in-depth analysis of the pattern and how you can use it to trade with greater success.
The futures price action suggests the Bulls are back in town!
The pre-market futures price action seems to indicate that the Bulls got everything they wanted over the weekend. The establishment candidates win in Europe removing much of the uncertainty of their path forward. Also, our President has put a very ambitious plan for Congress this week. Not only is he expecting the passage of the New Health Care plan but also his new Tax Plan as well as a budget extension.
The Bulls seem to like everything they hear and apparently want to party like it’s it 1999. As I write this, the Dow Futures are pointing to a nearly 200-point gap up. It would be easy to let our emotions run wild this morning but let’s not forget that Congress must get something done! Passing just one of these important measures would be a big week for this Congress let alone three! If they fail should we expect a similar Bearish response in the market?
As much as I love seeing resistance levels broken, I have to remember that a one day gap up move does not make a trend. A pullback to test support is not only possible but likely. It would not be out of the question to see a big intraday whipsaw to test support with emotions running this high. Keep a very close eye on price action this morning for quick reversals. The wise trader will maintain discipline and stick to their rules of engagement no matter how emotional the market may be.
On the Calendar
The Economic Calander starts with week with a whimper but will end with a roar. Today we have no major reports just a couple Fed speakers pontificating on interest rates. However, as we move the week progresses we have several market-moving stories with the GDP number front and center Friday morning. The Earnings Calendar kicks into high gear this week with nearly 1200 companies reporting by Friday. Today more than 100 report earnings, so it’s a good idea to check and recheck before entering new trades.
Action Plan
At 8:00 AM Central Time I am being interviewed on a local radio station. I should be finished up by the time the market opens today, but I will likely miss the first 30 minutes of the day. I’m not holding many positions and stops are in place, so nothing to worry about there. Just as soon as I get back, I will dive into the charts to see what I can find.
Keep in mind; we could experience a lot of volatility this morning. Sitting on your hands for the first 30 minutes to allow the wild price fluctuations subside would likely be a wise move today. Eventually, the Market could wake up to the fact that Congress saying they will do something is a long way from them getting it done! If they fail, I think we could see Bears regain control. Buckle up it could be a rough week!
[button_2 color=”orange” align=”center” href=”https://hitandruncandlesticks.sharefile.com/d-sd4b4b9974fa49fcb”]Morning Market Prep Video[/button_2]
Trade Wisely,
Doug
At Friday’s Close the Bears Lead
At Friday’s close, the Bears lead with the SPY closing below the 50-SMA and the T-Line below the 34-EMA.
The French election will likely dominate the market today and cause both the Bulls and Bears to flex their mussels, as you can see in the morning futures. The key will be the close as emotions calm down. The first step is to see a close over the 50-SMA followed by a close over $236.50 then $237.55.
Keep your eyes on the charts; they will tell the story as it unfolds.
Due to technical issues, I could not finish the morning report.
Rick
Yesterday’s price action was great but can it follow through?
Thursday’s price action was just enough to inspire a hopeful vision of bullishness. As nice as it was to get some relief from the selloff yesterday, more is needed to prove that its over. One of the first lessons to be learned in trading is that one day of bullish price action does not make a trend. Follow through is required.
A single day of price action can suggest reversal; it can inspire bullishness but it truth without following though it’s only hopeful speculation. Let’s keep in mind that the DIA and the SPY rallied to test resistance but failed to break it. On the other hand, the Q’s and the IWM found the energy to break resistance. Now the question is, can it hold?
Personally, I hope that it can, but I’m unwilling to speculate and risk my capital until I see a bit more proof. I have a rule that resistance does not become support until its tested. Over the year that rule has saved me from taking significant losses Hoping that support will hold. Hoping that something is true is natural but risking capital on Hope is nothing more than gambling. Las Vegas has build monuments with the lost capital of hopefulness. I understand that waiting is hard, but it’s my opinion that waiting is much easier than the pain of loss.
On the Calendar
We kick off the Economic Calendar today with a Fed speaker at 9:30 AM Eastern time. The PMI Composite number quickly follow at 9:45 AM with Existing Home Sales at 10:00. Both reports have the potential to move the market. It would be wise to keep an eye on price action after these reports with the market as such a critical point. On the Earnings Calendar, we have 36 companies reporting today but keep in mind there are 110 reporting Monday. Plan accordingly and be prepared. Not checking is lazy and we all know there is no room for lazy when our money is at stake!
Action Plan
As you know, I consider Friday as Pay Day! As a result, my focus shifts from buying to new positions to taking profits. With all the uncertainty we are currently experiencing in the world right now I feel much more comfortable reducing risk before the weekend. One of the hardest lessons I have ever learned is never to allow greed to get in the way of taking a profit. We all want to hold our for higher gains, but experience has taught me that very often less is more. Commissions are cheap. I can always buy a position back on Monday, but I can not guarantee there will be a profit unless I put it in the bank!
[button_2 color=”green” align=”center” href=”https://hitandruncandlesticks.sharefile.com/d-s398b6dc62b943489″]Morning Market Prep video[/button_2]
Trade Wisely,
Doug