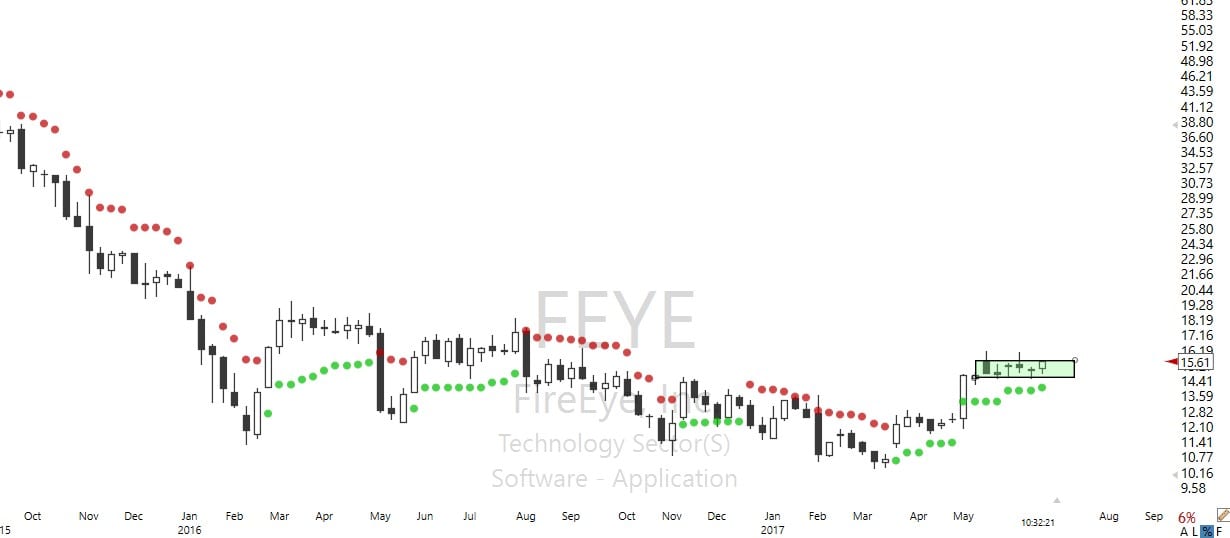
A new idea for your evaluation and consideration. I’m thinking longer term on this position so I will be using a weekly chart to manage. However, today on the daily FEYE has produced a Pop out of the box signal but it still under resistance. If the stock moves up we will treat this trade a Fig Leaf trade and begin selling calls against it.
 [button_2 color=”blue” align=”center” href=”https://www.screencast.com/t/ZCsGxIs5bVCv”]Trade Sheet Details[/button_2]
[button_2 color=”green” align=”center” href=”https://hitandruncandlesticks.sharefile.com/d-sc5e539fddd547c8b”]Trade Alert Video[/button_2]
The SPY Has Been Under A Little Pressure
(SPY) The SPY has been under a little pressure the last few trading days after making an all-time high. The Bulls still have the upper hand as long as they can maintain control of the $241.63 support area. The Bearish Engulf on the 3-day chart is still a problem the Bulls need to confront.
Free Trade Idea – IMGN
 IMGN (Immunogen Inc) Was first a members trade idea on Januar 4, 2017 and as of yesterday’s close is up 189.42%. On a 3-day chart, IMGN is headed for the 200-sma, and I believe more.
With on-demand recorded webinars, eBooks, and videos, member and non-member eLearning, plus the Live Trading Rooms, there is no end your trading education here at the Hit and Run Candlestick, Right Way Option, Strategic Swing Trade Service and Trader Vision.
Conditions For The IMGN Trade
- RBB setup 3-day chart
- Flag PBO
- Bullish J-Hook set up
- T-Line Bounce
- Swing or swings: 30% Plus
Why Trade With Hit and Run Candlesticks
DVAX is up 107.78% from our members only post on March 1, 2017; DVAX popped another 5.65% yesterday with a beautiful T-Line Run.
Hit and Run Candlesticks Movers Yesterday
- IMGN +11.07%
- NVCR 9.72%
- RHT 9.58%
[button_1 text=”Try%203-Months%20With%20Hit%20and%20Run%20Candlesticks” text_size=”32″ text_color=”#000000″ text_bold=”Y” text_letter_spacing=”0″ subtext_panel=”Y” subtext=”Guaranteed%2010%20trades%20over%2010%25″ subtext_size=”15″ subtext_color=”#f71818″ subtext_bold=”Y” subtext_letter_spacing=”0″ text_shadow_panel=”N” styling_width=”40″ styling_height=”30″ styling_border_color=”#000000″ styling_border_size=”1″ styling_border_radius=”6″ styling_border_opacity=”100″ styling_shine=”Y” styling_gradient_start_color=”#ffff00″ styling_gradient_end_color=”#ffa035″ drop_shadow_panel=”N” inset_shadow_panel=”N” align=”center” href=”https://ob124.infusionsoft.com/app/orderForms/Membership—Hit-and-Run-Candlesticks—Quarterly” new_window=”Y”/]
What is a Trade Idea Watchlist?
A trade idea watchlist is a list of stocks that we feel will move in our desired direction over a swing trader’s time frame. That time could be one to 15 days for example. From that watchlist, we wait until price action meets our conditions for a trade.
MEMBERS ONLY
Investing and Trading involve significant financial risk and are not suitable for everyone. No communication from Hit and Run Candlesticks Inc. is financial or trading advice. All information is intended for Educational Purposes Only. Terms of Service.
Rick Saddler is not a licensed financial adviser nor does he offer trade recommendations or advice to anyone except for the trading desk of Hit and Run Candlesticks Inc.
Choppy price action slightly favors the Bears.
 Yesterday the Bears had a tiny edge as the market moved south with choppy price action. It’s very important on to get lulled to sleep during slow and grinding markets. Big whips remain a strong possibility around index highs. Also, keep in mind that summer price action is often light on volume making it even more challenging to trade. Stay focused on price, stick to your rules and strive for your goals. Everything else is just distracting noise.
On the Calendar
The lite Economic Calendar continues today with the weekly Jobless Claims report at 8:30 AM Eastern. Claims have been tracking lower all year pointing to strong demand for labor. This week the forecasters expect only a tiny bump up from last week but still very low overall. After that, a 10:00 AM we have a Fed speaker and a bucket full of bond announcements that will largely go unnoticed by the market.
On the Earnings Calendar, there are 27 reporting earnings today to be aware of if you are holding or thinking of entering them as new positions. BERY is one that many were watching yesterday that reports after the bell.
Action Plan
DIA, SPY, and IWM all dipped lower yesterday with slow and grinding price action. As of now, I would say no technical damage to the charts has occurred. The VIX, although just slightly higher continues to show no fear of a breakdown and remains near historic lows. The QQQ’s managed to close higher yesterday despite the weakness of its fellow indexes. My guess is the burst of bullishness comes from the positive earnings seen in companies like RHT and ADBE. Keep in mind that the QQQ’s remain under price resistance and still has a lot of work to do if it intends to breakthrough
Futures are pointing to a slightly lower open this morning. I’m expecting that choppy and whippy price action will continue today. If the Bears don’t soon show some strength breaking below supports then start watching for a bounce. I will be looking for new trades, but I continue to plan to keep them small due to the choppy price action.
[button_2 color=”green” align=”center” href=”https://youtu.be/0vNvWePUR4s”]Morning Market Prep Video[/button_2]
Trade Wisely,
Doug
Another day, another reversal.
 On the close of Monday, it looked like the market had picked a direction Tuesday delivered another potential reversal signal. This kind of price action is not uncommon at or near market highs, but that doesn’t help us as traders when we continually receive reversal patterns. Ond day everything points to Bulls in control, but before you know it, tide shifts and Bears appear to gain control destroying your confidence and chopping up your account. The only way to avoid this to stop trading but that’s not something most of us want to hear. We want it, and we want it NOW! As for me, I will continue to trade, but I plan to trade less only taking the best fo the best setups. I also intend to trade smaller than normal positions to diminish my overall risk in the event I’m whipped out, by yet another reversal.
On the Calendar
The hump day Economic Calendar has a couple of important reports for the market to chew on this morning. First off at 10:00 AM Eastern time we get the Existing Home Sales number which was disappointing in April. Today the consensus says we should see a rebound to a 5.550 million annualized rate. There some concern that rising home prices might affect this number going forward. At 10:30 AM is the EIA Petroleum Status Report. The number last time continued to show a decrease in overall supply, but it was not enough to stop the decline in oil prices.
On the Earnings Calendar, we have 14 companies expected to report results today. There two big tech companies MU and ORCL that report after the close. Both companies will be important to the QQQ’s index to heal some of the technical damage it has suffered recently.
Action Plan
Yesterday saw light volume choppy price action most of the day. At the end of the day, the Bears gains strength pushing the SPY lower nearly filling the entire gap left behind on Monday. The DIA remained stronger avoiding a bearish engulfing candle by a tiny margin. With the reports from ADBE and FDX coming in strong after the close I was expecting to see the futures in positive territory, but as of now, they are showing slight weakness.
Adding new risk has been difficult as the market chops and whips around. Just when you think the all clear has sounded and we get price action that raises a lot of concerns. I will continue to look for new trades, but until I see this market settle down, I plan to take smaller positions. If I’m not whipped out, I can always add to the trade later. Remember activity does not equal achievement. Trading less or not trading at all during choppy times protects your capital.
[button_2 color=”orange” align=”center” href=”https://youtu.be/IRAnfQbUKqY”]Morning Market Prep Video[/button_2]
Trade Wisely,
Doug
Fearless market gaps to new record levels.
 Price action is showing amazing confidence as the fearless market gapped up and ran to new record levels yesterday. I must admit at these levels leaving gaps behind gives me pause, but the overall direction of the market is clear. The Bulls are in control, so I will continue to trade with the trend until price action provides clues to the contrary. Naturally, we all have a bias but it is the successful trader that sets it aside allowing the market to work for them rather than fighting it. We all want to be right but would you rather be right or profitable?
On the Calendar
Another light day on the Economic Calendar. There are 3 Fed Speakers as some bond auctions but no economic reports of note. The Earnings Calendar shows 21 companies reporting today including a few important name like ADBE, FDX, RHT, and LEN. FDX can move the market because many feel it is an indicator pointing out the health of the consumer. The report from FDX will not occur until after the market closes today.
Action Plan
The DIA displayed amazing strength yesterday gapping up and continuing up to new record highs once again. Also, the SPY dramatically improved, leaving a gap behind and managing a new closing high. The QQQ’s and the IWM lagged behind but managed to close near the high of the day. Fear once again is extremely low and only about 1 ½ points from new record lows.
There is no question that the Bulls are in control although volumes were slightly light yesterday. It is as if the market is melting up without concern. I have to admit that makes me a little nervous but all I have to do is to continue to trade with the direction of the overall market. The trend is up, so I will continue looking for long positions as long as that continues to be true. However, at these price levels, it is important not to become complacent. So I will be very focused on price action and prepared if clues of weakness start so show. Although I will be trading long, I will also increase my aggression when it comes to capturing gains. Swift reversals can occur around market highs. I will not allow winning trades to become losers.
[button_2 color=”blue” align=”center” href=”https://youtu.be/oIzIXXjCp6A”]Morning Market Prep Video[/button_2]
Trade Wisely,
Doug
Trading In The Direction Of The Market
(SPY) The profitable swing trader has discovered trading in the direction of the market is easier and more profitable. I believe this is something that will never change. The buyers continue to dominate the overall market with periods of consolidation and minor pullbacks which turn out to be buying opportunities.
The SPY is currently working on a Hammer / Bull Kicker and a rising 34-EMA. A close over $244.87 in the next few days would set up the SPY for another Bullish leg.
Free Trade Idea – SWIR
 SWIR (Sierra Wireless Inc.) Has started a bullish rise from the May 5 gap, over the past few days SWIR has formed a flag pull back. We feel this could be a opportunity before the breakout of the recent high.
With on-demand recorded webinars, eBooks, and videos, member and non-member eLearning, plus the Live Trading Rooms, there is no end your trading education here at the Hit and Run Candlestick, Right Way Option, Strategic Swing Trade Service and Trader Vision.
Conditions For The SWIR Trade
- Bullish gap
- Flag PBO
- Bullish J-Hook set up
- Bullish Engulf
- Swing or swings: 25% Plus
Why Trade With Hit and Run Candlesticks
WYNN is up 32.21% from our members only post on March 15, 2017; WYNN was another 3% yesterday on a breakout headed to our higher targets.
Email us back and let us know why your not a member and you could win a $20.00 gift card to Amazon. Will will be giving 5 Amazon gift cards away.
Hit and Run Candlesticks Movers Yesterday
- IMGN +7.21%
- CONN +6.67%
- NVCR +6.76%
What is a Trade Idea Watchlist?
A trade idea watchlist is a list of stocks that we feel will move in our desired direction over a swing trader’s time frame. That time could be one to 15 days for example. From that watchlist, we wait until price action meets our conditions for a trade.
MEMBERS ONLY
Investing and Trading involve significant financial risk and are not suitable for everyone. No communication from Hit and Run Candlesticks Inc. is financial or trading advice. All information is intended for Educational Purposes Only. Terms of Service.
Rick Saddler is not a licensed financial adviser nor does he offer trade recommendations or advice to anyone except for the trading desk of Hit and Run Candlesticks Inc.