INAP – Stick Sandwich Breakout

INAP – Stick Sandwich Breakout

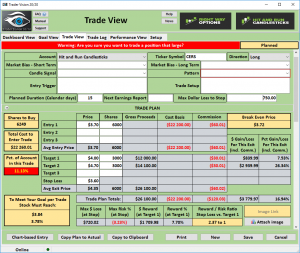
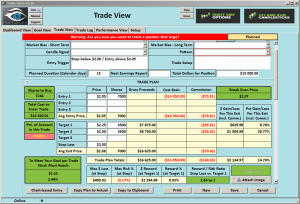
INAP – Stick Sandwich BreakoutINAP (Internap Corp) The INAP Chart has presented us with a bullish Stick Sandwich that broke out of a 2-month consolidation period. The first stick also printed a Bullish Morning Star signal. INAP is one that we will be watching for a better low-risk entry

►Talking about today’s Trade Ideas

Starting at 9:10 EST each day I explain the possible trade from start to finish: Why chosen, entry, stop and profit zones. Answer questions to help you succeed in trading.

MonthlyQuarterlySemi-AnnualAnnual • Change your future and enjoy the life of working from home with swing trading. The next step is up to you.

Good Trading – Hit and Run Candlesticks

Learn more about Hit and Run Candlesticks, and today’s trade idea and plan plus the 10 or more members trade ideas, starting at 8:45 EST AM every morning with the HOG and then Rick at 9:10 EST. Every day we teach and trade using the T-Line, Candlesticks, Support and Resistance, Trends, chart patterns and continuation patterns.

Trade Updates for Hit and Run Candlesticks

Currently holding ten long positions

MonthlyQuarterlySemi-AnnualAnnualWe control our risk and manage our gains • We teach the Same • Cancel Anytime


Ticker (WPRT) You could have profited about 34.95% or about $101.00, If 100 shares when we posted to our members on September 12.


Eyes On The Market (SPY)

FOMC minutes Wednesday. We have said the past few days the SPY was a bit long in the tooth and needed to slow down and that is what is happening. As long as the bull can keep the SPY above support, we are in good bullish shape, below $251.90 could be more than the bull can handle for awhile.

Above $10.50 the VIX would be poking the bear. The VIX ran to the 34-EMA yesterday closing just under on the daily chart. The 3-day chart the VIX is painting a Morning Star Candle signal along with a double bottom.

Rick’s trade ideas for the day – MEMBERS ONLY

MonthlyQuarterlySemi-AnnualAnnual


Investing and Trading involves significant financial risk and is not suitable for everyone. No communication from Hit and Run Candlesticks Inc. is financial or trading advice. All information is intended for Educational Purposes Only. Terms of Service.

Rick Saddler is not a licensed financial adviser nor does he offer trade recommendations or advice to anyone except for the trading desk of Hit and Run Candlesticks Inc.


Bulls continue to show strength.

Bulls continue to show strength.

Bulls continue to show strength.

Bulls continue to show strength.After such an impressive run higher, the Bulls continue to show strength this morning.  The Dow futures are pointing to a new record high, and the VIX hovers near historic lows.  Is there really no fear in the market or are we looking at mass complacency?  Your guess is as good as mine.  It is logical to think a pullback could begin at any time after such a strong bullish move.  However, it’s a mistake to try an predict a top.

As I was coming up as a trader, this is a mistake that I would repeat over and over.  I would predict that the market was up so much it absolutely had to come back down.  Sadly that proved to be a very costly mistake for me.  At times I would stand aside anticipating a pullback only the watch the market continues moving higher and leaving behind.  I would often miss out on the biggest bull run of the year.  Even worse I would at times get short thinking the Bears had to take over soon only to be run over by the bulls.

When we look at the charts, it’s logical to think a pullback is likely and we should prepare.  However, if we put our bias aside, we see a chart showing no evidence of a pullback as of now.  I am not suggesting we should throw caution to the wind and buy with both hands if fact I have been taking profits into the strength.  I am only trying to suggest that you see the chart as it is not as you believe it should be!  Emotion can easily trump logic making a run last much longer than anyone expects.

On the Calendar

About all that’s on the Economic Calendar is that today is Columbus Day.  As a result, banks and bond markets closed in observance of the national holiday.

On the Earnings Calendar, there are 14 companies reporting today, but I don’t see anything particularly noteworthy or market moving.

Action Plan

The DIA, SPY, IWM, and QQQ’s decided to a little rest on Friday morning, but the Bulls had another plan’s for the afternoon lifting them off the intraday lows.  The QQQ’s managed a new record high close by the end of trading on Friday following through after it’s impressive breakout Thursday.  As of now, the futures are suggesting a bullish open today with the Dow possibly opening today’s trading at yet another record high.  Friday saw the VIX rise slightly after having reached a new closing low Thursday.

With the banks closed today it’s possible we could see a choppy light day after the morning rush.  There are a lot of good-looking charts to choose from but make sure that you’re not chasing.  I want to continue to trade long with this very bullish trend however we should not be surprised to see profit taking begin at any time.  Plan accordingly.

Trade Wisely,

Doug

[button_2 color=”green” align=”center” href=”https://youtu.be/KzGpch83i3I”]Morning Market Prep Video [/button_2]

ARLM – Breakout, Flag, and Hammer On Support

ARLM – Breakout, Flag, and Hammer On Support

ARLM – Breakout, Flag, and Hammer On SupportARLM (Alarm Com) The ALRM Chart has presented us with a bullish trend, breakout, flag and hammer on support. Bullish confirmation above the Hammer usually within 3-4 days. Expected buying above the Hammer body open.

►Talking about today’s Trade Ideas

Starting at 9:10 EST each day I explain the possible trade from start to finish: Why chosen, entry, stop and profit zones. Answer questions to help you succeed in trading.

MonthlyQuarterlySemi-AnnualAnnual • Change your future and enjoy the life of working from home with swing trading. The next step is up to you.

Good Trading – Hit and Run Candlesticks

Learn more about Hit and Run Candlesticks, and today’s trade idea and plan plus the 10 or more members trade ideas, starting at 8:45 EST AM every morning with the HOG and then Rick at 9:10 EST. Every day we teach and trade using the T-Line, Candlesticks, Support and Resistance, Trends, chart patterns and continuation patterns.

Trade Updates for Hit and Run Candlesticks

Last week we closed a couple of positions and took 50% off the take on several positions to protect over the weekend.

MonthlyQuarterlySemi-AnnualAnnualWe control our risk and manage our gains • We teach the Same • Cancel Anytime


Ticker (SHW) – You could have profited about 11.3%% or about $3382.00, If 100 shares when we posted to our members on September 11.


Eyes On The Market (SPY)


With a bank holiday today and a Fed FOMC meeting on Wednesday I would suspect the market will be somewhat quite until Wednesday afternoon.

Friday the SPY closed with an inside day doji, the 8th day in a row that the SPY closed higher than it’s open. Price Action and the T-Line are still working together to create a bullish environment.

Friday the VIX closed higher than it’s open and closed above the previous day’s candle. Near historical lows and in double bottom territory the VIX may be trying to mount a upward push. Above $10.50 would be poking the bear.

Rick’s trade ideas for the day – MEMBERS ONLY

MonthlyQuarterlySemi-AnnualAnnual


Investing and Trading involves significant financial risk and is not suitable for everyone. No communication from Hit and Run Candlesticks Inc. is financial or trading advice. All information is intended for Educational Purposes Only. Terms of Service.

Rick Saddler is not a licensed financial adviser nor does he offer trade recommendations or advice to anyone except for the trading desk of Hit and Run Candlesticks Inc.


E-Learning TOS Analysis Tab

[img_text_aside style=”1″ image=”https://hitandruncandlesticks.com/wp-content/uploads/2017/10/TOS-Analyze-Tab.png” image_alignment=”right” headline=”TOS%20Analysis%20Tab” alignment=”center”]In this Members E-Learning class, we covered the basics of the TOS Analysis page.  Plan and visualize new positions or repair and improve existing trades.  There are almost endless possibilities.

[/img_text_aside] [button_2 color=”green” align=”center” href=”https://hitandruncandlesticks.sharefile.com/d-sc4b866179e3475da”]Click Here to Watch the TOS Analysis Tab Replay Video[/button_2]


Can this Bull Run continue?

Can this Bull Run continue?

Can this Bull Run continue?As this week trading week comes to a close, the majority of traders have just one question on their mind.  Can this Bull Run continue?  Common sense would tell us the odds of a pullback after seven straight days of new records is pretty high.  However, the strength of the run ahead of earnings season already defies logic.  I say that only to remind you that predicting what a market may or may not do is an exercise in futility.  Anything is possible!  The best we can do as traders is have a plan with a set of rules to manage our emotions.  As a result of my rules made it necessary for me to lighten up my risk to the market by taking some profits.  Logic says a pullback is likely, but the price action has no hint of a pullback as of now.  If there are more buyer than sellers, then the market could still move higher!  What matters is that you are managing you and remembering that this is a business.

On the Calendar

On the Economic Calendar today we have the Mr. Big report at 8:30 AM with the Employment Situation.  As this report will incorporate the effect of the hurricanes, the consensus estimates are all over the place.  Essentially the best they can do is guess.  For example, the nonfarm payroll expects 100K, but the consensus ranges between Zero and 140K.  There are two reports unlikely to move the market, Wholesale trade at 10:00 AM and Consumer Credit at 3:00 PM.  There are 5 Fed Speakers on the calendar today.

On the Earnings Calendar, there are only eight companies reporting today.  I do not see any earnings reports that are particularly notable.

Action Plan

After the news reported a successful vote in Congress allowing the Tax Plan Process to move forward, the Bulls came out in force to express their support.  As I mentioned above, I reduced some of my risk to the market closing part or all of a few positions to capture gains ahead of the weekend.  The VIX made a new closing low yesterday below a 9-handle.  Truly amazing!  I think it would be wise to guard yourself against complacency.

Once again I will be more focused on taking profits today, but I will not rule out the possibility of new trades.

Trade Wisely,

Doug

[button_2 color=”green” align=”center” href=”https://youtu.be/2vvoAqm9Wac”]Morning Market Prep Video[/button_2]

Friday – My Favorite Day of Trading

Friday – My Favorite Day of Trading

(It’s Friday) Friday is my favorite day of trading because it’s the day I get rewarded from a hard work week. Yep, every Friday I write a paycheck to myself from my trading account.

Friday is the day we count our money and reflect on our weeks trading. How did we do? How can we improve? Take time today to pause on trading and consider education. Reevaluate your trading goals, are your goals on track?

There are no trade ideas posted today, but you should have a running watchlist.

Good Trading – Hit and Run Candlesticks

Learn more about Hit and Run Candlesticks, and today’s trade idea and plan plus the 10 or more members trade ideas, starting at 9:10 EST AM every morning. Every day we teach and trade using the T-Line, Candlesticks, Support and Resistance, Trends, chart patterns and continuation patterns.

Trade Updates – Hit and Run Candlesticks

Yesterday we closed ½ ZYNE 12.88% • ½ GRPN 16.25% • ½ IDGX 21.48% • ½ MACK 10.78% • SEAS 1.68 • LOXO -.02%

Give us a try If you would like to learn what and how we do it click here to give us a try, cancel at any time.

Eyes on The Market

It sure has been a good week to trade with the overall market hitting new highs. We have moved our SPY pullback line up to $253.10. Any price action pullbacks above $253.10 we will consider bullish. I do feel this market may need a rest soon based on the length and the speed of the most recent rally. The T2122 indicator is also approaching the overbought area. For this reason, we did start hedging.

Rick’s trade ideas for the day MEMBERS ONLY

Start your education with wealth and the rewards of a Swing Traders LifeClick Here


Investing and Trading involves significant financial risk and is not suitable for everyone. No communication from Hit and Run Candlesticks Inc. is financial or trading advice. All information is intended for Educational Purposes Only. Terms of Service.

Rick Saddler is not a licensed financial adviser nor does he offer trade recommendations or advice to anyone except for the trading desk of Hit and Run Candlesticks Inc.