Weekly Options
 The Weekly Options idea in MU on Friday has paid off very well with better than 50% gains today. Congrats to those that took some risk on that position.
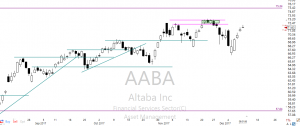
Today I have a very similar idea on AABA. the stock has rallied very strongly off the low but now seems to have bumped into resistance. Consider the 15 DEC AABA 44.5 Puts for a quick short. A close above today’s high would be a good reason to stop out of the trade. Plan to take profits quickly as well is the stock moves in our favor.
Recently Closed Trades
CSCO 17% • BAC 31% • CREE 48% • WMT 245% • NFLX -40% • STX 42% • 2nd CSCO Trade 30%
Today’s Market Prep Note
With the Dow Futures pointing to a gap up open and the VIX once again dropping below a 10-handle all is well in the market. Or is it? Let’s keep remember; it was just a week ago that many were calling a blow-off top! The truth is no one knows the future and thinking we can predict it is nothing more than ego trampling common sense. However, if set aside our bias focus on price and listen closely, the market will whisper clues and allow us to take calculated risks. Otherwise know as trade planning! Not just some of the time, All the Time. each and every trade! So the questions is, are you listening or are you still trying to predict? With a gap up to new market highs, the market is whispering to me to avoid chasing this morning and watchful of possible whipsaws. Also with the FOMC on Wednesday, choppy boring price action could lie ahead.
Become a Member Today!
30 Day Trial Monthly Semi-Annual Annual
Investing and Trading involves significant financial risk and is not suitable for everyone. No communication from Hit and Run Candlesticks Inc. is financial or trading advice. All information is intended for Educational Purposes Only. Terms of Service.
Doug Campbell is not a licensed financial adviser, nor does he offer trade recommendations or advice to anyone except for the trading desk of Right Way Options Inc.
Are you still trying to predict?
 With the Dow Futures pointing to a gap up open and the VIX once again dropping below a 10-handle all is well in the market. Or is it? Let’s keep remember; it was just a week ago that many were calling a blow-off top! The truth is no one knows the future and thinking we can predict it is nothing more than ego trampling common sense. However, if set aside our bias focus on price and listen closely, the market will whisper clues and allow us to take calculated risks. Otherwise know as trade planning! Not just some of the time, All the Time. each and every trade! So the questions is, are you listening or are you still trying to predict? With a gap up to new market highs, the market is whispering to me to avoid chasing this morning and watchful of possible whipsaws. Also with the FOMC on Wednesday, choppy boring price action could lie ahead.
On the Calendar
The Economic Calendar this week kicks off at 10:00 AM Eastern with the JOLTS report. Job openings have been running very strong. In September JOLTS counted 6.093 open jobs around the country. The consensus for October sees that number increasing to 6.100 million. We round out the remainder of the calendar with bond announcements and auctions.
Ther are 18 companies on the Earnings Calendar expected to report results. A quick look and I don’t see any that is particularly notable or likely to move the market. However,r if you now one them they certainly have the power to move your account. Make sure to check as part of your daily planning.
Action Plan
Last Friday saw the both the DIA and SPY make new record high close while still below the high print. The QQQ gapped but ran into some sellers at price resistance as did the IWM. Overall the day was bullish leaving behind a lot of really good looking charts. Maybe it’s just me, but the price action seemed to lack commitment or perhaps it’s just a little tentative ahead of the FOMC this week.
Futures opened bullishly and currently seems to have strengthed that sentiment into the pre-market session. The CBOE kicked off trading in Bitcoin futures last night, and the overall market appears to be completely twitterpated by an intangible one and zero digital currency. It will certainly be interesting watch which I intend to do from the safety of the sidelines. It will not be a surprise if the market becomes slow and choppy after the morning rush today. Keep in mind the FOMC is expected to raise interest rates on Wednesday. Also be on the lookout for whipsaw price action as we test market highs.
Trade Wisely.
Doug
[button_2 color=”green” align=”center” href=”https://youtu.be/8A8sggFZSGc”]Morning Market Prep Video[/button_2]
Watching The 3-Day Chart
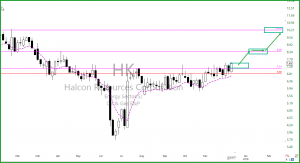
 HK – I am watching the 3-day chart starting with the candle on July 12. The chart pattern from July 12 has floated sideways with support around $5.80. Then on November 2, a little upward trend started. Now support has kicked up a little to about $5.60. Notice how the 34-EMA has risen above the 200-SMA
At 9:10 AM ET. We will talk about the technical properties of HK with target zones, a couple of logical entries and a protective stop. We will also be showing our trade plan with risk/reward and expected profits.
To the member’s area for the Trader Vision Trade Plan that we have created for ourselves.
► Must Read Trade Update (TRLD)
On August 31, we shared and covered in detail the technical properties of TLRD in the Trading Room, Friday the profits were about 64.20% or $764.00, with 100 shares. TLRD broke out of out (RBB Pattern) and continued the trend with minor pullback opportunities (PBO). Moving the stop up to about $18.85 would make sense.
[button_2 color=”orange” align=”center” href=”https://ob124.infusionsoft.com/app/orderForms/HRC-Hit–Run-Candlesticks-30-day-Trial-1497″ new_window=”Y”]30-Day Trial Hit and Run Candlesticks • Earn While You Learn[/button_2]
► Eyes On The Market
The SPY was able to rise off the T-Line last week and close Bullish. On the daily chart, a Bullish J-Hook Continuation pattern is forming, A close above $266.38 would confirm the Bullish J-Hook Pattern. Sometimes it’s hard to make sense of a grouping of candles on a daily chart, so you might want to look at a higher time frame. Take a look at the 4-day chart; you can see a bullish Doji Continuation Patter formed. The bulls simply need to follow through and stacking.
Rick’s trade ideas for the day – MEMBERS ONLY
30-Day Trial • Monthly • Quarterly • Semi-Annual • Annual
Learn how and what we trade: The T-Line • T-Line Bands • Chart Patterns • Support • Resistance • Patterns • Buy Box • Volatility Stops • Price Action • Candlesticks • Profit Zones • Entry Zones • Protective Stops
Investing and Trading involves significant financial risk and is not suitable for everyone. No communication from Hit and Run Candlesticks Inc. is financial or trading advice. All information is intended for Educational Purposes Only. Terms of Service.
Rick Saddler is not a licensed financial adviser nor does he offer trade recommendations or advice to anyone except for the trading desk of Hit and Run Candlesticks Inc.
*************************************************************************************
A Quick Short

Yesterday’s Free Trade, UAL, Moved up nicely yesterday and gaped for a one day return of nearly 30%. Congrats to those who took advantage of the idea. Now let’s look to the future for a quick short idea.
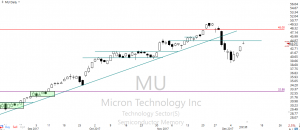
MU has made a nice recovery but seems to have run headlong into price resistance. Take a look at the MU 15 DEC 46 strike Put weekly contacts. This trade will gives us a nice negative delta position with plenty of open interest. Theta is the enemy here so if MU does not make a move lower by Wednesday 13th consider closing the position. If MU closes above resistance you may also want to close the position.
Recently Closed Trades
CSCO 17% • BAC 31% • CREE 48% • WMT 245% • NFLX -40% • STX 42% • 2nd CSCO Trade 30%
Today’s Market Prep Note
During the evening the Congress passed a continuing resolution that prevents a government shut down. However, their action only extended the battle for 2-weeks. Now the question is will the hoped-for Santa Claus Rally be held, hostage by Congress? Santa held hostage, shame on you Congress! My feeble attempt at humor is simply point out that the market will likely remain sensitive to the spin out of Washington D.C. Of course, the bulls could find their inspiration in the Employment situation number to move higher, but the governmental pressure will be ever-present. Also, weighing on the mind of the market is the upcoming FOMC meeting. As for me, I will continue to focus on price action and continue to trade with the trend. However, I may trade smaller than normal positions due to the uncertainty of the new cycle.
Become a Member Today!
30 Day Trial Monthly Semi-Annual Annual
Investing and Trading involves significant financial risk and is not suitable for everyone. No communication from Hit and Run Candlesticks Inc. is financial or trading advice. All information is intended for Educational Purposes Only. Terms of Service.
Doug Campbell is not a licensed financial adviser, nor does he offer trade recommendations or advice to anyone except for the trading desk of Right Way Options Inc.
Mostly Winning Trades
 This past week I have seen mostly winning trades come out of the trading room with only a few losses, but one thing is for sure the trading has slowed because of the market. For the most part, the SPY has been unsure of its self but held the -Line, the QQQ’s didn’t like being above the T-Line so had to test what it was like below (now back above), IWM and the DIA’s liked being above the T-Line and stayed. IYT felt like the king of the hill held proud above the T-Line the entire week and last week too. Leading sectors above the T-Line this week has been, (SX100 Industrials) (SX60 Healthcare) (SX20 Consumer Cyclical) (SX50 Consumer Defensive)Tax bill, Employment numbers, Fed Rate Increase are just to name a few issues that could change the course of the charts.
►Sample • Members Recent Big Winners
BEND 25.55% • DEPO 46.14% • EYES 19.12% • TLRD 63.96% • X 27.96% • 21.5 • VIAB 13.35%
►News From Our Team
Trader Vision 20/20 – I have downloaded the newest version this morning, and the word is to give it a spin. We are very excited that Trader Vision 20/20 is just days from being launched. What is one thing the top traders do? They plan their trades and trade their plan. Trader Vision 20/20 is perfect for planning your trade.
Before Christmas is announcing a way that most (not all) will be able to cut their membership cost by 50-100% – I am currently using this product and love it. By the way, there is NO COST TO YOU
► Eyes On The Market
On the daily chart, the buyers have kept the closing price above the T-Line, this suggests the bulls still control the trend, and the bears are just grazing a little. After all, the bear needs to eat too. A close below $262.15 will put a strain on the trend that the buyer may not like. The VIX settled down a bit yesterday closing back below the Lower T-Line Band; this is good for the bulls.
Rick’s trade ideas for the day – MEMBERS ONLY
30-Day Trial • Monthly • Quarterly • Semi-Annual • Annual
Investing and Trading involves significant financial risk and is not suitable for everyone. No communication from Hit and Run Candlesticks Inc. is financial or trading advice. All information is intended for Educational Purposes Only. Terms of Service.
Rick Saddler is not a licensed financial adviser nor does he offer trade recommendations or advice to anyone except for the trading desk of Hit and Run Candlesticks Inc.
Santa held Hostage?
 During the evening the Congress passed a continuing resolution that prevents a government shut down. However, their action only extended the battle for 2-weeks. Now the question is will the hoped-for Santa Claus Rally be held, hostage by Congress? Santa held hostage, shame on you Congress! My feeble attempt at humor is simply point out that the market will likely remain sensitive to the spin out of Washington D.C. Of course, the bulls could find their inspiration in the Employment situation number to move higher, but the governmental pressure will be ever-present. Also, weighing on the mind of the market is the upcoming FOMC meeting. As for me, I will continue to focus on price action and continue to trade with the trend. However, I may trade smaller than normal positions due to the uncertainty of the new cycle.
On the Calendar
We begin the Friday Economic Calendar with the very important Employment Situation report at 8:30 AM Eastern. Consensus for November expects a strong showing between 184,000 and 190,000. The overall rate is seen holding at 4.1% with hourly earnings increasing 0.3%. At 10:00 AM we get a reading on Consumer Sentiment which is expected to tick higher to 98.8 vs. 98.5 last month. Wholesale Trade numbers are also at 10:00 AM with the oil rig count at 1:00 PM. Neither of which are likely to move the market.
On the Earnings Calendar, we only have 8-companies reporting. Looking through the list, I would not expect any of today’s reports to affect the overall market.
Action Plan
Yesterday’s modest bounce held some key support levels and provided some much need relief. There are a lot of charts showing bullish patterns. Now, all we need is a little more volume to build some momentum, to continue the trend. Currently, the Dow Futures are suggesting a positive option on the news from capitol hill. During the evening Congress passed a continuing resolution that avoids a Saturday shutdown of the government. Unfortunately, they only kick the can down the road two weeks. That means the budget battle will continue and the market will remain sensitive to the news. Perhaps the market will get a shot in the arm after the Employment Situation report to reinforce and inspire the bulls higher.
Trade Wisely,
Doug
[button_2 color=”green” align=”center” href=”https://youtu.be/JWrGekLWsCE”]Morning Market Prep Video[/button_2]
RBB Pattern
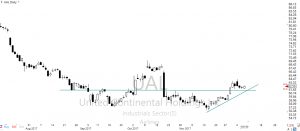
 With the news that oil supplies are the price of oil has started moving lower. One very big beneficiary of declining oil price is the airlines. UAL looks to have completed a bottom pattern and breaking above resistance.
The light volume pullback has now set up one of my favorite trading patterns, the RBB Pattern. (Rounded Bottom Breakout) We may be a little early with this idea but the pattern is now providing a very low risk entry. To take advantage of this idea consider the JAN 57.5 Calls for a quick directional trade. A move up to just $65 could produce more than a 45% return. A close below support would be a reason to stop out of the position.
Recently Closed Trades
CSCO 17% • BAC 31% • CREE 48% • WMT 245% • NFLX -40% • STX 42% • 2nd CSCO Trade 30%
Today’s Market Prep Note
With the last 3-days of selling, traders are starting to wonder, Where is Santa? Gloom and doomers have been predicting the demise of the 2017 bull run all year. Now having strung together the first 3-day selling streak since August they are out in force predicting the market top has happened. Could they be right? Of course, even a broken watch is right twice a day. Before diving headlong into a pit of despair take a minute to examine the charts. The DIA and the SPY are still trending up! The QQQ’s are suggesting caution, and the IWM is holding a significant support. Also, take notice that there has been no panic selling and the VIX is not registering fear. Historically the so-called Santa Rally appears 7 to 10 days after the beginning of December. Stay focused on price it will provide us the answers.
Become a Member Today!
30 Day Trial Monthly Semi-Annual Annual
Investing and Trading involves significant financial risk and is not suitable for everyone. No communication from Hit and Run Candlesticks Inc. is financial or trading advice. All information is intended for Educational Purposes Only. Terms of Service.
Doug Campbell is not a licensed financial adviser, nor does he offer trade recommendations or advice to anyone except for the trading desk of Right Way Options Inc.
 The Weekly Options idea in MU on Friday has paid off very well with better than 50% gains today. Congrats to those that took some risk on that position.


