STRL Gapped And Strolled Sideways
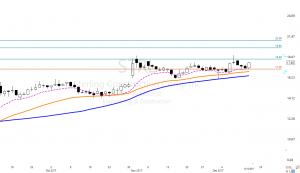 STRL – Gapped and strolled sideways for about a month now in a tight trading range. Price action seems to be playing well with support, the lower T-Line band, and the V-Stop. I am bullish above $17.20 with a buy zone between $17.20 and $18.40.
At 9:10 AM ET. We will talk about the technical properties of STRL with target zones, a couple of logical entries and a protective stop. We will also be showing our trade plan with risk/reward and expected profits.
►Subscribing Members login: for the Trader Vision Trade Plan
► Must Read Trade Update (LB)
On October 9, we shared and in detail the technical properties of LB in the Trading Room, Yesterday the profits were about 37% or $1590.00, with 100 shares. After the October 5th candle LB followed The Lower T-Line Band and the V-Stops perfectly.
[button_2 color=”orange” align=”center” href=”https://ob124.infusionsoft.com/app/orderForms/Gold-Monthly-Membership-85″ new_window=”Y”]Learn how to use the T-Line Bands and The V-Stop • Cancel Anytime[/button_2]
► Eyes On The Market
The market survived the FOMC! However, you see the intraday price action or even the daily for that matter the trend is still bullish. The SPY has put together six higher lows and highs working to beat the December 4 high. The $25000 magnet in the DOW may be stronger than the bears can handle, just something to think to ponder.
The VXX short-term futures are trending down below the V-Stop and the Lower T-Line Band, (No change from yesterday)
Rick’s Swing Trade ideas – MEMBERS ONLY
30-Day Trial • Monthly • Quarterly • Semi-Annual • Annual
Learn how and what we trade: The T-Line • T-Line Bands • Chart Patterns • Support • Resistance • Patterns • Buy Box • Volatility Stops • Price Action • Candlesticks • Profit Zones • Entry Zones • Protective Stops
Investing and Trading involves significant financial risk and is not suitable for everyone. No communication from Hit and Run Candlesticks Inc. is financial or trading advice. All information is intended for Educational Purposes Only. Terms of Service.
Rick Saddler is not a licensed financial adviser nor does he offer trade recommendations or advice to anyone except for the trading desk of Hit and Run Candlesticks Inc.
*************************************************************************************
Big News Day
 I have to admit that I was somewhat surprised that yesterdays FOMC announcement turned out to be such a non-event. The market just yawned and saw nothing to react too. Today is another big news day with some big after the bell earnings reports tossed in for good measure. The Bulls are firmly in control buy at the end of the day yesterday price action suggested a little weariness and maybe a rest in the rally is possible. With all the news the market will have a lot to chew on and potentially react so stay on your toes. In an all bull market it’s very easy to become complacent because you can buy almost anything at anytime and the rising tide makes you money. Guard yourself against complacency by staying focused on the only thing that really matters, Price! The clues will be there if you watch and listen to the market.
On the Calendar
We kick off the Thursday Calendar with the weekly Jobless Claims at 8:30 AM Eastern. The after-effects of Hurricane Maria are expected to continue to impact initial claims with a rise to 239k vs. 236k. Also at 8:30 AM is the Retail Sales numbers which are expected to see the core rate rise by a solid 0.4%. To finish the 8:30 AM data dump is Import and Export Prices where forecasters see imports rising 0.7% with exports only increasing 0.3%. At 9:45 we get the PMI Composite a reading above 50 indicates manufacturing growth while a sub-50 print points to a decline. Business Inventories comes out at 10:00 AM and forecasters see a 0.1% draw-down in inventories which is considered bullish. After that, we have a few non-market-moving reports and bound announcements.
The Earnings calendar show just over 30 companies reporting today. There are several big noteworthy reports after the bell such as ADBE, COST, ORCL & JBL.
Action Plan
The strength and longevity of this current rally is a bit spooky but also very impressive. Spooky because the DIA has managed to leave behind gaps 5-days in a row, and impressive in breadth. Once again new records were set in the DIA and the SPY. A 25,000 Dow print is now only 325 points away, and the bulls seem very determined to get it there. However, with the late afternoon selling yesterday across all indexes perhaps a little rest in this bull march is possible. There is a big economic data dump today as well as several big earnings reports after the bell so the market will have a lot reaction worthy events today.
Currently, futures are once again suggesting a gap up in the Dow, and the VIX continues to register little to no fear. There is no denying that the trend is up and the bulls are in control. As a result, I will stay long and continue to look for long trades as long as that condition exists. Long ago I learned the hard way that trading my bias, predicting market turns and fighting the market was a losing business model! However, that does not mean we should be complacent and toss caution to the wind. Stay focused on price, listen to the market and be flexible enough to adapt if a change appears.
Trade Wisely,
Doug
[button_2 color=”green” align=”center” href=”https://youtu.be/vk5ZMfMY62Q”]Morning Market Prep Video[/button_2]
Stick with the plan
 Yesterday’s trade suffered a pullback at the open this morning breaking our quick profits winning streak. However, with FOMC decision today I’m am going to stick with the plan thinking it could still pop depending on the news. As I said yesterday if TBT breaks support close the position.
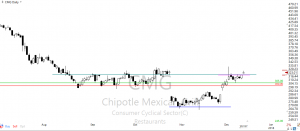
Today I’m looking at trade on CMG. the stock gaped up this morning and is currently pulling back to price support. If support holds consider a weekly contract bull put credit spread. Take a look at the 22 DEC 17 series, selling the 305 Puts and buying the 300 Puts. If CMG falls below $311.50 closing the trade to avoid the risk should be considered.
Recently Closed Trades
CSCO 17% • BAC 31% • CREE 48% • WMT 245% • NFLX -40% • STX 42% • 2nd CSCO Trade 30%
Today’s Market Prep Note
Waiting for the Fed. After this FOMC meeting, we will likely be bidding farewell to Chairman Yellen. As her final act, she will likely leave us with an interest rate increase. That’s not a surprise the FOMC has been projecting that possibility for months now. However, there is speculation she could leave us with a nasty surprise on Wednesday in response to the Tax Reform bill. Many are thinking the FOMC could project additional interest rate increases next year as a result. Currently, they are projecting just three. Any additions could make for an interesting market reaction at tomorrow. Plan accordingly. Also, keep in mind that as the market waits for the official FOMC statement price action normally becomes light and choppy. As we reach out for new all-time highs, it would be wise to keep that in mind as you plan the path forward.
Become a Member Today!
30 Day Trial Monthly Semi-Annual Annual
Investing and Trading involves significant financial risk and is not suitable for everyone. No communication from Hit and Run Candlesticks Inc. is financial or trading advice. All information is intended for Educational Purposes Only. Terms of Service.
Doug Campbell is not a licensed financial adviser, nor does he offer trade recommendations or advice to anyone except for the trading desk of Right Way Options Inc.
GLUU Bullish W Pattern
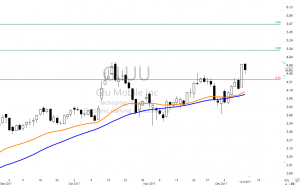 GLUU – Is testing the October highs with a little pullback yesterday. GLUU also has broken out of a Bullish “W” pattern while following the 34-EMA bullish trend. With a price above the weekly 200 period moving average GLUU could be headed to challenge the $7.00 area. Take a look at the weekly chart and notice the Cup being formed.
At 9:10 AM ET. We will talk about the technical properties of GLUU with target zones, a couple of logical entries and a protective stop. We will also be showing our trade plan with risk/reward and expected profits.
►Subscribing Members login: for the Trader Vision Trade Plan
[arrows style=”arrow-red-9.png” align=”left”]
► Must Read Trade Update (BNED)
On November 30, we shared and in detail the technical properties of BNED in the Trading Room, Yesterday the profits were about 33% or $400.00, with 200 shares. BNED has followed the T-Lines up and is now creating a bullish J-Hook continuation pattern; this could be a clue that aside from normal profit-taking pullbacks the trend is still bullish.
[button_2 color=”green” align=”center” href=”https://hitandruncandlesticks.com/hrc-rwo-30-day-offer/” new_window=”Y”]Trial ? Hit and Run or Right Way • No Auto Billing[/button_2]
► Eyes On The Market
Yesterday the market was mostly mixed, likely waiting to hear about the FOMC minutes and what Jannet Yelling has to say today. The SPY broke out and closed above the December 4 candle, if you look at you 4-day chart you can see a Bullish Doji continuation pattern. I am hearing from so many traders that feel this market is so overbought; I agree to remember price action and the trend is what to watch. As of yesterday, December 12-13-17 does the chart look bullish or bearish? Depending on the FOMC minutes price could accelerate higher or drop like a rock, we simply can not predict that.
The VXX short-term futures are trending down below the V-Stop and the Lower T-Line Band.
Rick’s trade ideas for the day – MEMBERS ONLY
30-Day Trial • Monthly • Quarterly • Semi-Annual • Annual
Learn how and what we trade: The T-Line • T-Line Bands • Chart Patterns • Support • Resistance • Patterns • Buy Box • Volatility Stops • Price Action • Candlesticks • Profit Zones • Entry Zones • Protective Stops
Investing and Trading involves significant financial risk and is not suitable for everyone. No communication from Hit and Run Candlesticks Inc. is financial or trading advice. All information is intended for Educational Purposes Only. Terms of Service.
Rick Saddler is not a licensed financial adviser nor does he offer trade recommendations or advice to anyone except for the trading desk of Hit and Run Candlesticks Inc.
*************************************************************************************
Mixed Signals
 The four major indexes left behind mixed signals yesterday even as new record highs printed. Unsettled price action ahead of the FOMC is not a surprise but couple that with market highs and the uncertainty meter maxes out. Toss in a political upset that could threaten the tax reform plan, and policy going forward we could see some turbulent price action. During major news events, we lose our edge. Candle signals, price patterns, support, resistance, and trend are no match if the market becomes emotional. Please understand I’m not suggesting that it will become emotional only that the possibility exists. When we trade without an edge, it’s no different than standing at a roulette wheel betting on red or black. My focus today is on preserving profits and protecting capital rather than adding risk.
On the Calendar
The hump day Economic Calendar begins at 8:30 AM with the Consumer Price Index. Forecasters see the overall CPI rising 0.4%, with 0.2% taking out food and energy. Year-on-year, the CPI is seen rising 2.2% with the core at 1.8%. At 10:30 AM is the important EIA Petroleum Status Report that last reading showed a build in supplies and raised questions on demand. Of course what the market is really waiting for is the FOMC Announcement & forecasts at 2:00 PM. Everyone is expecting a rate increase however the forecast could be the wild card if additional rates increase are expected next year. At 2:30 will be Chairman Yellen’s final FOMC press conference.
On the Earnings Calendar we have about 30 companies reporting results, but once again I don’t see any market-moving reports. Please keep checking reporting dates!
Action Plan
Yesterday the market left behind a mix of signals, but uptrends are still intact. The DIA and the SPY both made record highs yesterday but found some sellers in the afternoon session. The SPY printed a possible topping shooting star pattern by the close day raising a little uncertainty. The QQQ’s chose to rest with a spinning top doji, and the IWM headed south with a bearish engulfing however still above support. A little uncertainty ahead of the FOMC announcement & forecasts is not that unusual, but the fact it’s happening at a market high should raise a few caution flags for today.
I’m expecting a choppy day up until the FOMC at 2:00 PM then anything is possible. Expect very fast intraday price action after the announcement with the possibility of whipsaw reversals that could continue through the press conference. I won’t rule out new trades today but will say it would be very unlikely due to the loss of edge around a new event such as the FOMC. Although the Futures have pointed to bullish to flat open, I would not be at all surprised to see some selling this morning to capture profits ahead of the unknown. If the Bears do come out to play, I will not hesitate to bank some profits.
Trade Wisely,
Doug
[button_2 color=”green” align=”center” href=”https://youtu.be/ytKnjDB71vE”]Morning Market Prep Video[/button_2]
FOMC Trade
 Today I have an FOMC Trade in mind but before that, the short trade on MU worked out very well. If you held it through to this morning you should have pocketed better than 40% gain. Congrats to those who took the trade.
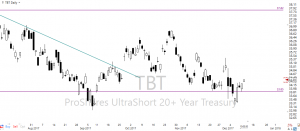
With he FOMC meeting beginning today and the expected rise interest rates I want to pick up some TBT. Bonds are normally negatively affected when rates rise. With possibility that the Fed may project more rate hikes next year due to the Tax Reform bill we could get a bigger reaction. To take advantage of that consider the TBT JAN 33 Calls. A close below price support would be a good time to stop out.
Recently Closed Trades
CSCO 17% • BAC 31% • CREE 48% • WMT 245% • NFLX -40% • STX 42% • 2nd CSCO Trade 30%
Today’s Market Prep Note
Waiting for the Fed. After this FOMC meeting, we will likely be bidding farewell to Chairman Yellen. As her final act, she will likely leave us with an interest rate increase. That’s not a surprise the FOMC has been projecting that possibility for months now. However, there is speculation she could leave us with a nasty surprise on Wednesday in response to the Tax Reform bill. Many are thinking the FOMC could project additional interest rate increases next year as a result. Currently, they are projecting just three. Any additions could make for an interesting market reaction at tomorrow. Plan accordingly. Also, keep in mind that as the market waits for the official FOMC statement price action normally becomes light and choppy. As we reach out for new all-time highs, it would be wise to keep that in mind as you plan the path forward.
Become a Member Today!
30 Day Trial Monthly Semi-Annual Annual
Investing and Trading involves significant financial risk and is not suitable for everyone. No communication from Hit and Run Candlesticks Inc. is financial or trading advice. All information is intended for Educational Purposes Only. Terms of Service.
Doug Campbell is not a licensed financial adviser, nor does he offer trade recommendations or advice to anyone except for the trading desk of Right Way Options Inc.
Looking At The 3-Day Chart
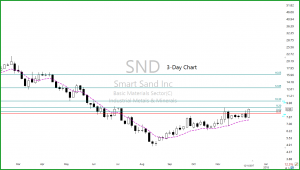 SND – The Bullish trend started in mid-August3. Looking at the 3-day chart price action is being supported by the September highs, the last 7 bars (3-day chart) has painted a Pop Out of The Box pattern. Bullish over $8.60 with profit target zones above.
At 9:10 AM ET. We will talk about the technical properties of SND with target zones, a couple of logical entries and a protective stop. We will also be showing our trade plan with risk/reward and expected profits.
To the member’s area for the Trader Vision Trade Plan
► Must Read Trade Update (EYES)
On December 4, we shared and covered in detail the technical properties of EYES in the Trading Room, Yesterday the profits were about 47% or $500.00, with 800 shares. EYES has been creating a bottom, after breaking out ran to the next profit zone. The PBO Bullish Engulf on December 1 kicked off the run.
[button_1 text=”Monthly%20Membership%20Only%2085.00″ text_size=”32″ text_color=”#000000″ text_bold=”Y” text_letter_spacing=”0″ subtext_panel=”Y” subtext=”Start%20Now%20%E2%80%A2%20Cancel%20Anytime” subtext_size=”18″ subtext_color=”#0c23e4″ subtext_bold=”Y” subtext_letter_spacing=”0″ text_shadow_panel=”N” styling_width=”40″ styling_height=”30″ styling_border_color=”#000000″ styling_border_size=”1″ styling_border_radius=”6″ styling_border_opacity=”100″ styling_shine=”Y” styling_gradient_start_color=”#ffff00″ styling_gradient_end_color=”#ffa035″ drop_shadow_panel=”N” inset_shadow_panel=”N” align=”center” href=”https://hitandruncandlesticks.com/hit-and-run-candlesticks/” new_window=”Y”/]
► Eyes On The Market
The SPY has worked hard to overcome the Bearish Engulf on December 4 and has done a great job. The recent pullback used the V-Stop, and the T-Lines have continued to trend. The 4-day chart has painted a Bullish Doji continuation pattern. As of the close, yesterday price action still suggests bullishness. The VXX short-term futures are trending down below the V-Stop and the Lower T-Line Band.
Rick’s trade ideas for the day – MEMBERS ONLY
30-Day Trial • Monthly • Quarterly • Semi-Annual • Annual
Learn how and what we trade: The T-Line • T-Line Bands • Chart Patterns • Support • Resistance • Patterns • Buy Box • Volatility Stops • Price Action • Candlesticks • Profit Zones • Entry Zones • Protective Stops
Investing and Trading involves significant financial risk and is not suitable for everyone. No communication from Hit and Run Candlesticks Inc. is financial or trading advice. All information is intended for Educational Purposes Only. Terms of Service.
Rick Saddler is not a licensed financial adviser nor does he offer trade recommendations or advice to anyone except for the trading desk of Hit and Run Candlesticks Inc.
*************************************************************************************
Waiting for the Fed
 Waiting for the Fed. After this FOMC meeting, we will likely be bidding farewell to Chairman Yellen. As her final act, she will likely leave us with an interest rate increase. That’s not a surprise the FOMC has been projecting that possibility for months now. However, there is speculation she could leave us with a nasty surprise on Wednesday in response to the Tax Reform bill. Many are thinking the FOMC could project additional interest rate increases next year as a result. Currently, they are projecting just three. Any additions could make for an interesting market reaction at tomorrow. Plan accordingly. Also, keep in mind that as the market waits for the official FOMC statement price action normally becomes light and choppy. As we reach out for new all-time highs, it would be wise to keep that in mind as you plan the path forward.
On the Calendar
The beginning of the FOMC meeting tops the Economic Calendar today and will weigh on the mind of the market. At 8:30 AM Eastern is the PPI report which consensus suggests will once again show an increase of 0.3%. Food prices are also expected to show in an increase of 0.2%. We have a couple of bond auctions mid-day and then close the calendar with the Treasury Budget at 2:00 PM. I doubt that its any surprise that the deficit continues to rise now expected to top 134 Billion.
The Earnings Calendar indicates 28 companies will report earnings today with the majority of them coming after the bell. Make sure you always know about and have a plan for companies you hold that are reporting. A little effort can save you a lot!
Action Plan
Another day of record closes for the DIA and SPY as steady grind higher. The DOW is only 600 points from that big round number of 25,000. I suspect that’s a headline the market would like to see. In fact, I would bet they already have the hats and t-shirts printed in anticipation. The QQQ’s ended the day yesterday showing nice strength making a record high attempt look possible again. The Russell decided to largely take the day off and chose not to participate in the Bull Party.
This morning the Futures are once again pointing to small gap up open. The VIX- continues to fall and is once again approaching record low territory. An 8-handle print is only 34 points away which is amazing to me considering the elevation of the market. With up-trends intact on the overall market, I will continue to look for long trades with low-risk entry points. I will also stay very focused on price action looking possible reversal points as the DIA and SPY stretch out for the all-time high print. Keep in mind the FOMC meeting begins today and a slow, choppy market is often the result as we wait.
Trade Wisely,
Doug
[button_2 color=”green” align=”center” href=”https://youtu.be/PSNSsnXyGBg”]Morning Market Prep Video[/button_2]
 STRL – Gapped and strolled sideways for about a month now in a tight trading range. Price action seems to be playing well with support, the lower T-Line band, and the V-Stop. I am bullish above $17.20 with a buy zone between $17.20 and $18.40.


