Focus on Improvement
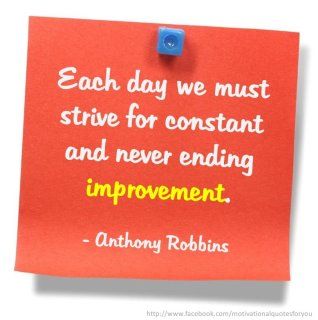
 It’s customary as the year winds down to reflect on the past year. While I’m very grateful for the amazing results that 2017 provided, my focus tends to center on the year ahead. I’m not talking about trying to predict the future as so many traders attempt to do. No matter how 2017 turned out for our future has yet to be written. As a result, I tend to focus on improvement as a trader. As the CEO of my trading business, I must always be on the lookout for ways to improve so my business can grow. Most people don’t like change but change we must it achieve better results. Embrace the change and challenge yourself to improve. Today, right this minute, make the decision to step up. Be willing to do whatever it takes to exercise your right to succeed.
On the Calendar
The Friday Economic Calendar is devoid of any market moving reports today. There are two note settlements and an oil rig count report but other than that a quiet day.
On the Earnings Calendar, there are only eight companies expected to report as we wind down the trading year.
Action Plan
After the morning flurry of activity, the market as expected slipped into choppy price action. It was surprising to see some bulls wake up in the last 30 minutes of trading to close the DIA, SPY, and IWM higher on the day. The QQQ’s, on the other hand, decided just to rest. Dow futures are pointing to a bullish open that may come close to making a record high print at the open.
Overall the trends continue to remain bullish with no signs of any meaning selling or market fear. Nevertheless, I plan to avoid adding risk just ahead of a long holiday weekend. As a result, my focus is on profit taking and capital protection today. There are a lot of very good looking charts on my shopping list for next year. Expect volume to decline a quickly today as many traders will be headed out for New Years celebrations.
2017 has certainly been an exciting record-breaking year filled with amazing profits for which I am very grateful. I want to wish you all a safe and Happy New Year.
Trade wisely,
Doug
[button_2 color=”green” align=”center” href=”https://youtu.be/8rFyeMqZo8Q”]Morning Market Prep Video[/button_2]
Never Say Never
 As this amazing year winds down, it seems more and more logical that light volume chop is likely to continue. But never say never with the Bulls having such a big target of 25,000 just above. The odds of that occurring are quickly diminishing, but you never want to rule out the power of a big round number. Futures are pointing to a bullish open, but volume is anemic and likely to decline quickly after the morning flurry of activity. If you continue to hold market risk, stay focused on price and guard against complacency. Although it may appear unlikely, this record-breaking year could still have a trick or two up its sleeve.
On the Calendar
Thursday’s Economic Calendar gets going at 8:30 AM Eastern with International Trade in Goods & Jobless Claims. The goods deficit is expected to slightly narrow to $67.7 billion in November vs. October’s reading of $68.1. Jobless Claims forecasters see a decline 240K vs. last week 245k print as demand for labor remains very strong. At 11:00 AM is the EIA Petroleum Status Report which if not forecast but the trend has been showing a slight drawdown in supplies helping to bolster the energy sector. After that, there are several reports unlikely to move the market as well as several Bill Announcements.
There are nine companies expected to report today, mostly considered penny stocks and very unlikely to have any market effect.
Action Plan
Although I have been under the weather, I have continued to keep very close tabs on the market. So far this week light volume and choppy price action have reigned supreme. The question is will that continue as trading this year rapidly winds down. Logic would say yes but with Dow 25,000 only 225 points away a bullish push is not out of the question. After all underestimating the Bulls this year would have been a mistake of a lifetime. Having said that I think its still very wise to be very cautious in such light volume market conditions.
Rather than adding risk ahead of another long weekend, I will be more focused on building shopping lists for next year, taking profits and protecting capital.
Trade Wisely,
Doug
[button_2 color=”green” align=”center” href=”https://youtu.be/92AmxWLWn74″]Morning Market Prep Video[/button_2]
Geeze This Market Is Slow
 Geeze this market is slow. For the next two days (Thursday/Friday) we will not be offering any trade ideas or trading picks on our blog, the market is just to darn slow and dead. If something changes, we will change. The trading room will be open, and we will discuss possible trades as we see them. There is simply a time to trade and times to sit back and enjoy. We hope this year has been good to you and that your trading and education goals have been met. If you feel like sharing your trading and educational goals, please email us @ https://hitandruncandlesticks.com/contact/ we will do our very best to help, use subject line “GOALS”
At 9:10 AM ET. We will talk about the technical properties of charts with target zones, logical entries, and protective stops.
► Eyes On The Market
The overall market has been horrible slow this week, and the next 2-days will likely be the same. We have had a few great discussions in the trading room. As of the close yesterday the bulls are holding there support with only a few minor signs of cracks, nothing I am going to worry about right now. We feel the best way to handle this market right now is to “Do Nothing” enjoy the family and the holiday time. Forcing trades never work out in the end.
Rick’s Swing Trade ideas – MEMBERS ONLY
30-Day Trial • Monthly • Quarterly • Semi-Annual • Annual
Learn how and what we trade: The T-Line • T-Line Bands • Chart Patterns • Support • Resistance • Patterns • Buy Box • Volatility Stops • Price Action • Candlesticks • Profit Zones • Entry Zones • Protective Stops
Investing and Trading involves significant financial risk and is not suitable for everyone. No communication from Hit and Run Candlesticks Inc. is financial or trading advice. All information is intended for Educational Purposes Only. Terms of Service.
Rick Saddler is not a licensed financial adviser nor does he offer trade recommendations or advice to anyone except for the trading desk of Hit and Run Candlesticks Inc.
*************************************************************************************
Ascending Triangle Breakout – BAS
 BAS – Broke out of an ascending triangle yesterday after a gap five days ago. With a series of higher lows and capped tops, BAS gapped on 12/20 above the Upper T-Line. The following three days held support, and yesterday more buyers stepped in. There are three important areas, and I will be talking about them in the Pre-market education series. Why do some traders make money and some loose money on the same trade? Something to ponder, ask for the answer if you like.
At 9:10 AM ET. We will talk about the technical properties of TAHO with target zones, a couple of logical entries and a protective stop. We will also be showing our trade plan with risk/reward and expected profits.
►Subscribing Members login: for the Trader Vision Trade Plan
► Eyes On The Market
Boring, boring, boring is all I can say about this market. The bulls still hold the chips as of yesterdays close
Rick’s Swing Trade ideas – MEMBERS ONLY
30-Day Trial • Monthly • Quarterly • Semi-Annual • Annual
Learn how and what we trade: The T-Line • T-Line Bands • Chart Patterns • Support • Resistance • Patterns • Buy Box • Volatility Stops • Price Action • Candlesticks • Profit Zones • Entry Zones • Protective Stops
Investing and Trading involves significant financial risk and is not suitable for everyone. No communication from Hit and Run Candlesticks Inc. is financial or trading advice. All information is intended for Educational Purposes Only. Terms of Service.
Rick Saddler is not a licensed financial adviser nor does he offer trade recommendations or advice to anyone except for the trading desk of Hit and Run Candlesticks Inc.
*************************************************************************************
Morning Star Flag Breakout – TAHO
 TAHO – Is working on a Morning Star Flag Breakout Has flagged above the 50d-SMA after a new low and a Bullish Morning Star kicked off a 10% plus run. We will be using our (RBB) Rounded Bottom Breakout Strategy to trade TAHO. Trade wise and trade with rules.
At 9:10 AM ET. We will talk about the technical properties of TAHO with target zones, a couple of logical entries and a protective stop. We will also be showing our trade plan with risk/reward and expected profits.
►Subscribing Members login: for the Trader Vision Trade Plan
► Eyes On The Market
Giving last week was Holiday slow and this week is likely to be the same we should expect the overall market to see weakness and a short burst of energy. Looking at the SPY, the bulls are still in charge and should remain in charge as long as they can hold above the $264.00 line. I expect the current week to be slow and weak.
Rick’s Swing Trade ideas – MEMBERS ONLY
30-Day Trial • Monthly • Quarterly • Semi-Annual • Annual
Learn how and what we trade: The T-Line • T-Line Bands • Chart Patterns • Support • Resistance • Patterns • Buy Box • Volatility Stops • Price Action • Candlesticks • Profit Zones • Entry Zones • Protective Stops
Investing and Trading involves significant financial risk and is not suitable for everyone. No communication from Hit and Run Candlesticks Inc. is financial or trading advice. All information is intended for Educational Purposes Only. Terms of Service.
Rick Saddler is not a licensed financial adviser nor does he offer trade recommendations or advice to anyone except for the trading desk of Hit and Run Candlesticks Inc.
*************************************************************************************
Getaway Day
 Combine Friday and the last trading day before Christmas, and you might hear volume sucked out the market. Today is the perfect storm for a Getaway Day for the long weekend. As always there will likely be a flurry of opening activity, but after that, expect very light volume chop. Monday the market is closed, and I would not be at surprised to light volume next Tuesday as traders extend their vacation. If your not planning to take the day off then work on your trading plan for next year. Review your past trades and look for ways to improve. Clean your watchlists and prepare shopping lists for next year. It’s also a very good time to study new techniques or strategies to improve as a trader. I wish you all a Very Merry Christmas!
On the Calendar
The last day of trading before Christmas see an Economic Calendar with several important reports. At 8:30 AM Eastern is the Durable Good Orders which consensus sees increasing by 2%. Even after excluding transportation orders are expected to increase by a solid gain of 0.5% with the core number growing by 0.4%. Also at 8:30 AM is Personal Income and Outlays which income is seen rising 0.4% and consumer spending up 0.5% with the holiday boost. At 10:00 AM is New Home Sales is expecting a decline from October’s 685K vs. Novembers 650K. At 10:00 AM is Consumer Sentiment that is expected to remain very strong with a consensus estimate of 97.0.
On the Earnings Calendar, there are only six companies expected to report today now of which are particularly notable.
Action Plan
The Bulls found a little inspiration yesterday gaping up and pushing higher during the day. Unfortunately, the last hour of the day saw some significant profit taking once again confirming a reason for caution. Currently, the uptrend is still intact, and the VIX showed no rising fear. Futures are currently positive removing the possibility of a government shutdown by passing a CR that’s good through January 19, 2018.
After the morning rush, I expect today’s volume to drop faster than the Times Square New Years Eve ball. Although I will be at my desk, I will not be doing any trading other than maybe taking some profits.
Trade Wisely,
Doug
[button_2 color=”green” align=”center” href=”https://youtu.be/gAx3piDsmQE”]Morning Market Prep Video[/button_2]

 It’s customary as the year winds down to reflect on the past year. While I’m very grateful for the amazing results that 2017 provided, my focus tends to center on the year ahead. I’m not talking about trying to predict the future as so many traders attempt to do. No matter how 2017 turned out for our future has yet to be written. As a result, I tend to focus on improvement as a trader. As the CEO of my trading business, I must always be on the lookout for ways to improve so my business can grow. Most people don’t like change but change we must it achieve better results. Embrace the change and challenge yourself to improve. Today, right this minute, make the decision to step up. Be willing to do whatever it takes to exercise your right to succeed.


