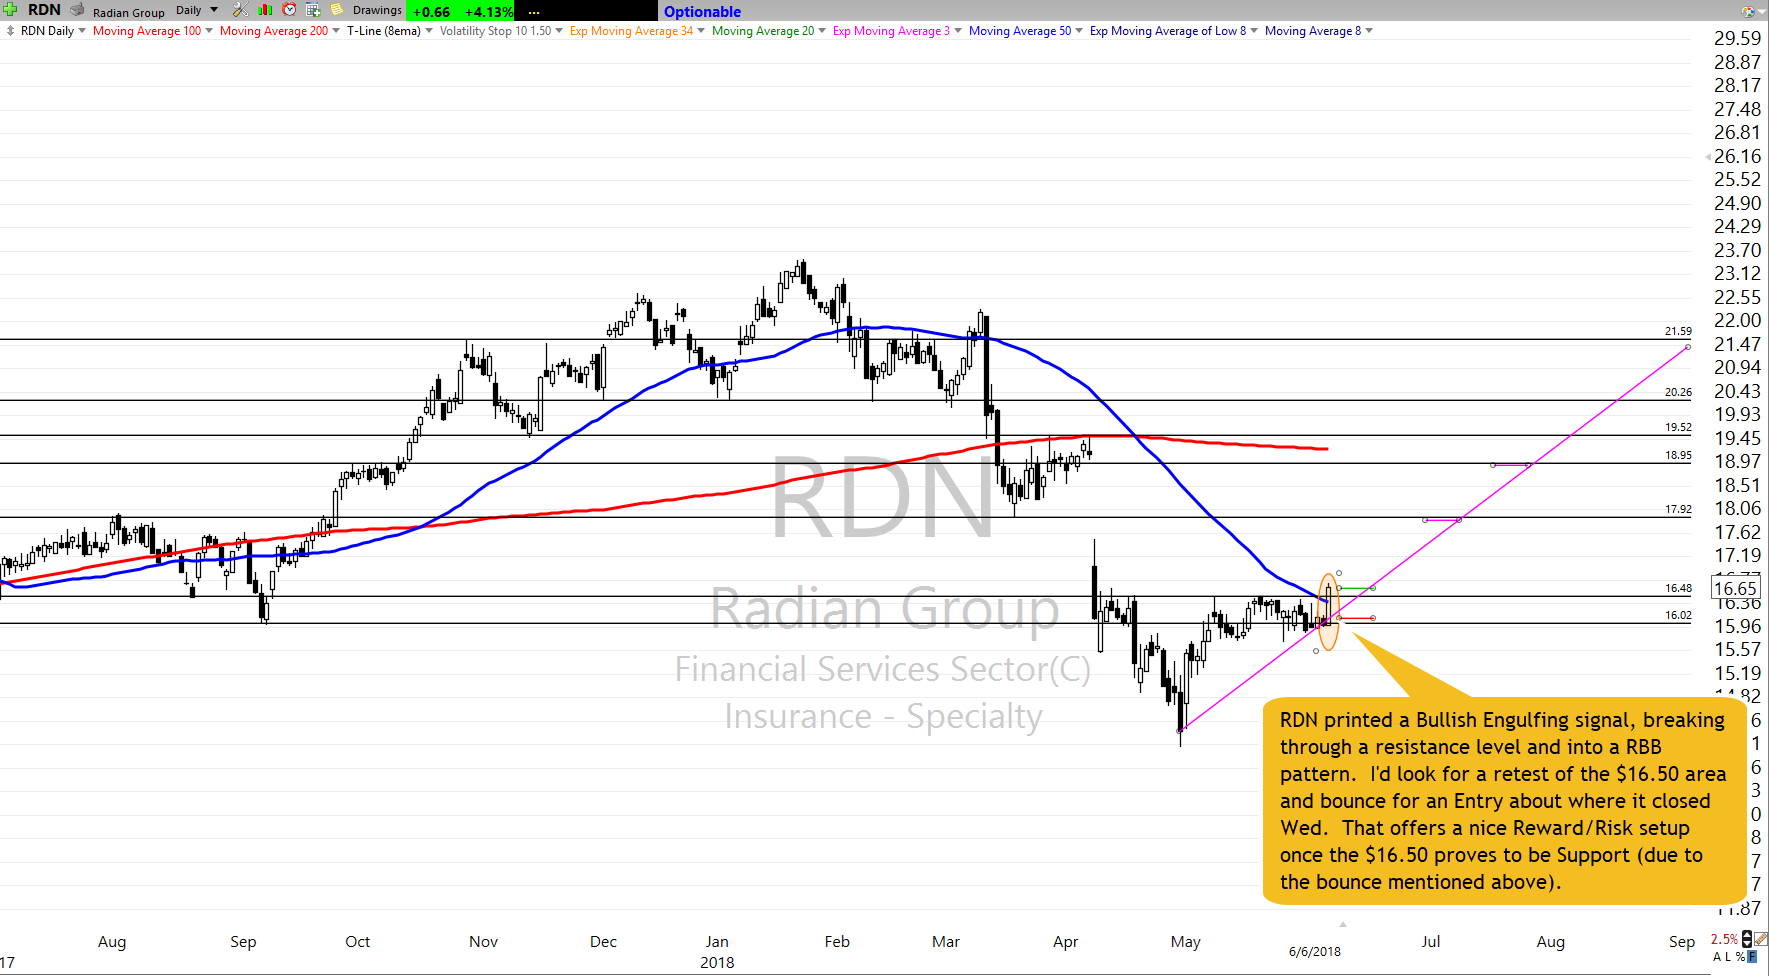
Trade Performance Feature Trade Ideas Follow-Up
On Friday’s, Hit and Run Candlesticks does not issue Featured Trade Ideas. So, instead of planning a new trade, we’ll use Friday’s to check the performance of our trades to date, check on our open trades and adjust and positions as needed. Since this is our first review, we’ll cover the 2 closed trades as well as our 5 open trades on Featured Trade Ideas. We’ll also adjust a few Stops. As a bonus, if you click the green button below, you’ll be able to watch a video where I review these trades and discuss how and why I adjust my positions using Trader Vision 20/20 software.
Of course, members can listen to Rick’s analysis of the overall market and his open position in the trading room at 9:10am Eastern.
Featured Trade Idea Account Performance As of 6-7-18 Close
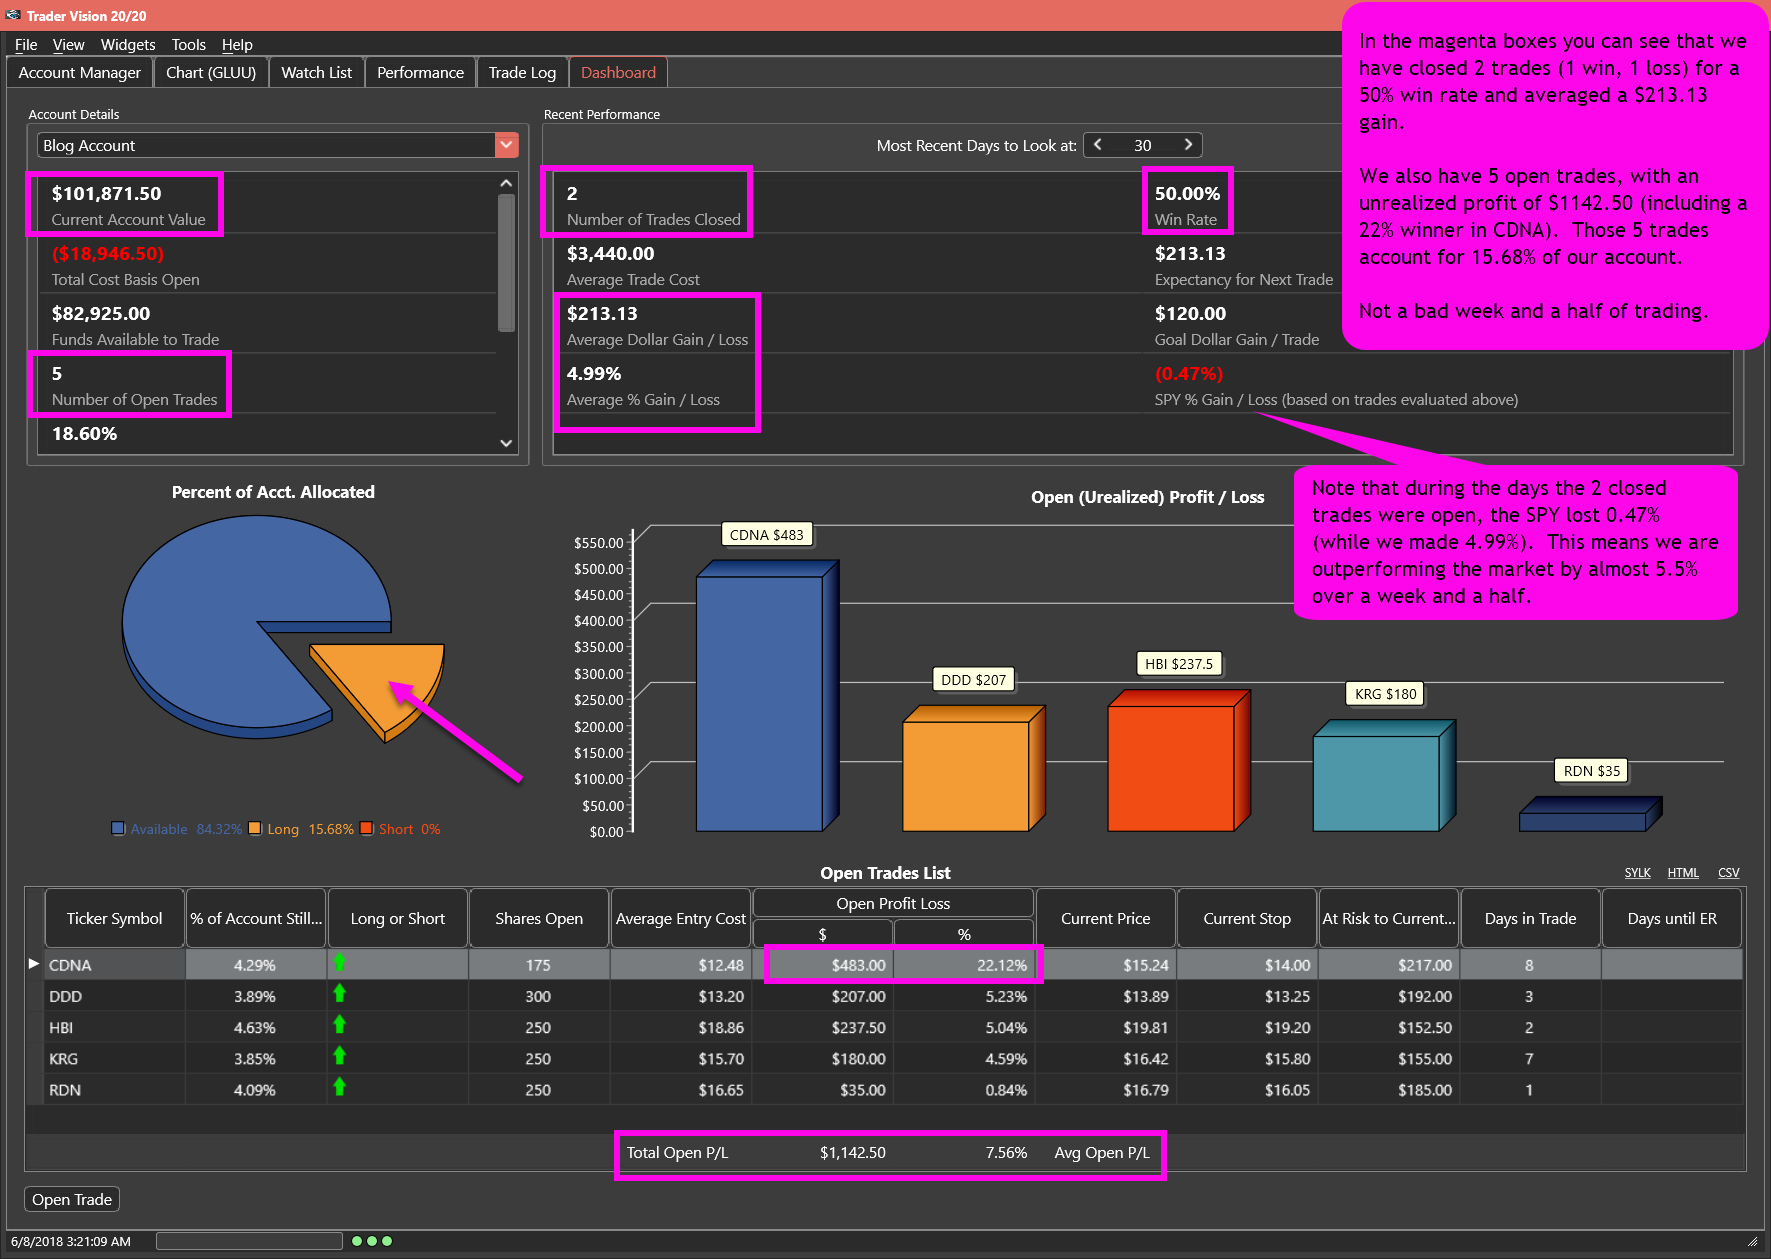
2 Closed trades (one $506.25 winner, one $80 loser) and 5 open trades (all in the green).
+$1871.50
Not too bad for less than two weeks trading!
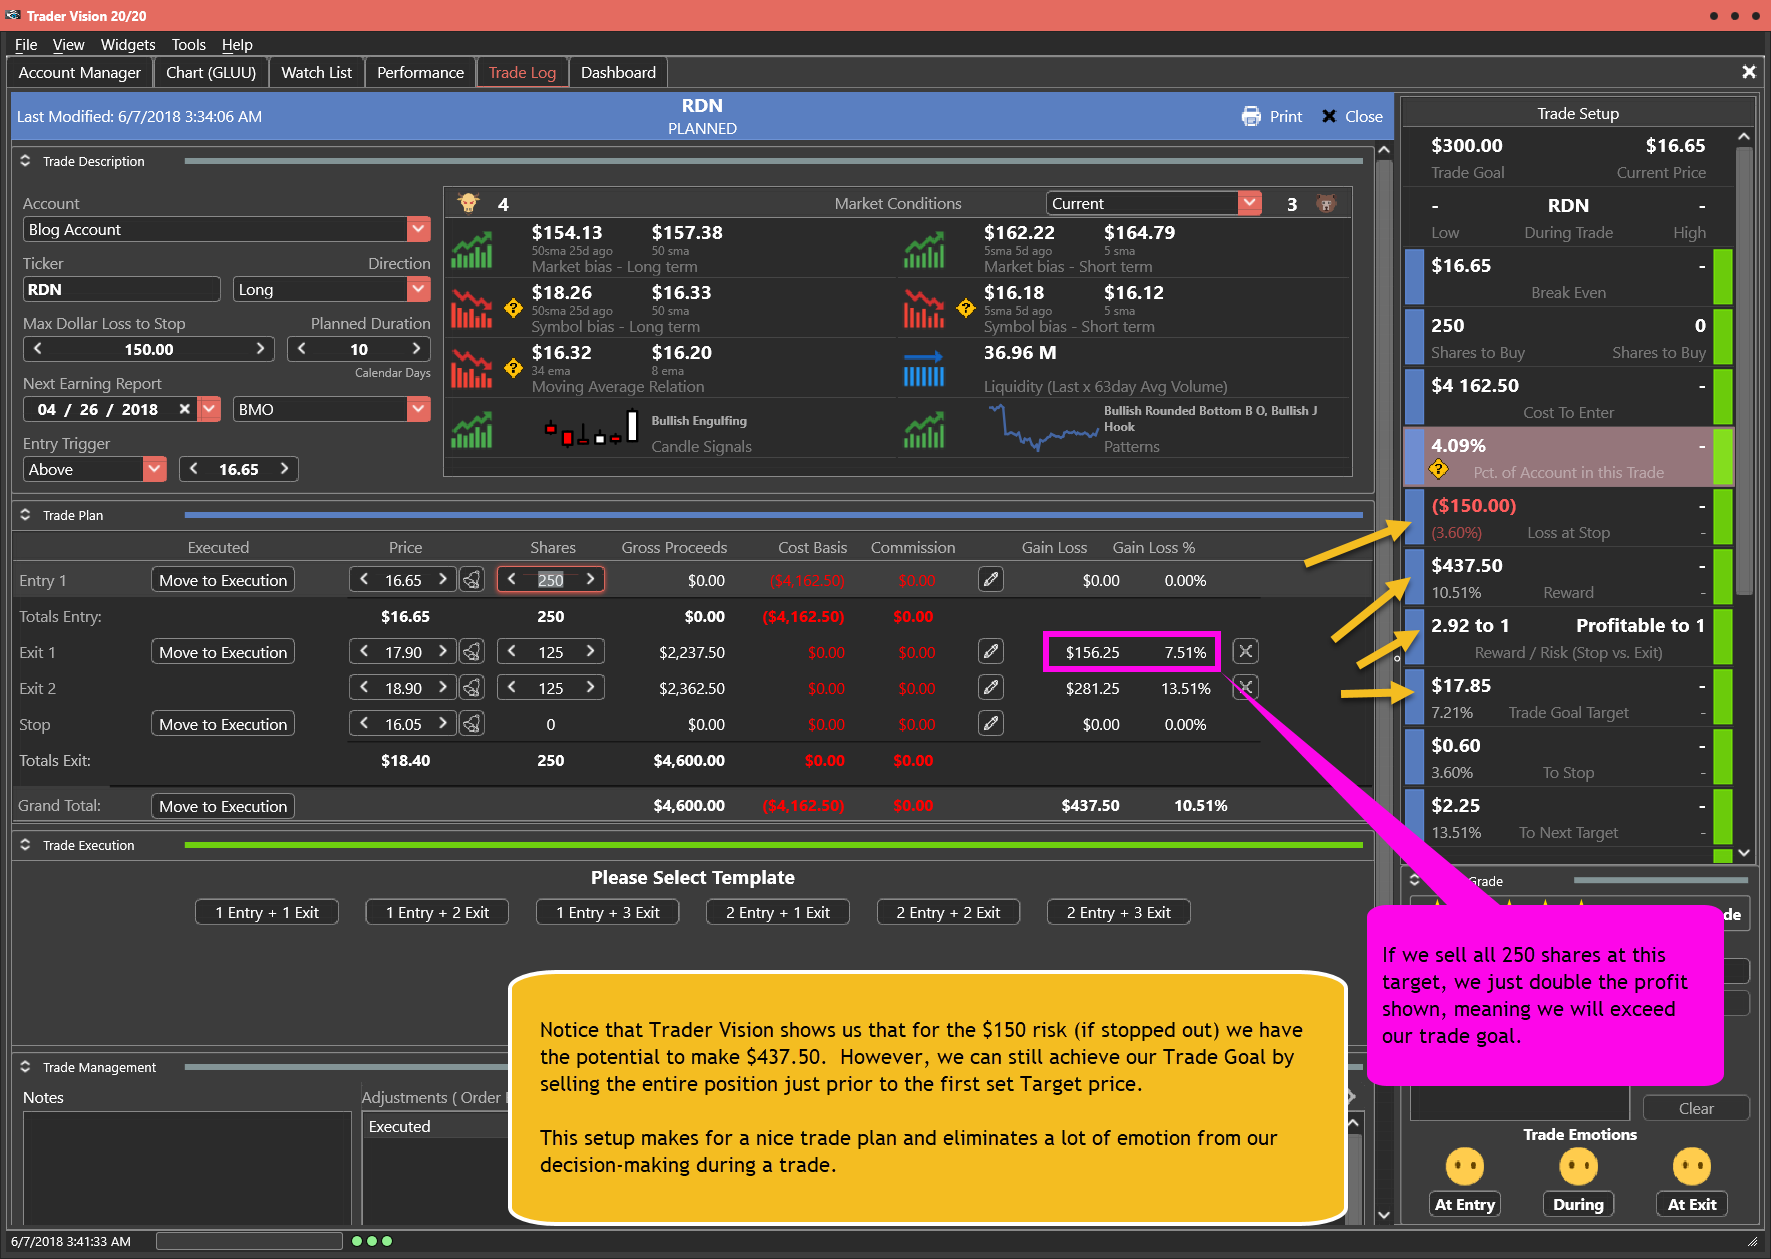
Blog Account Trade Log as of 6-7-18 Close
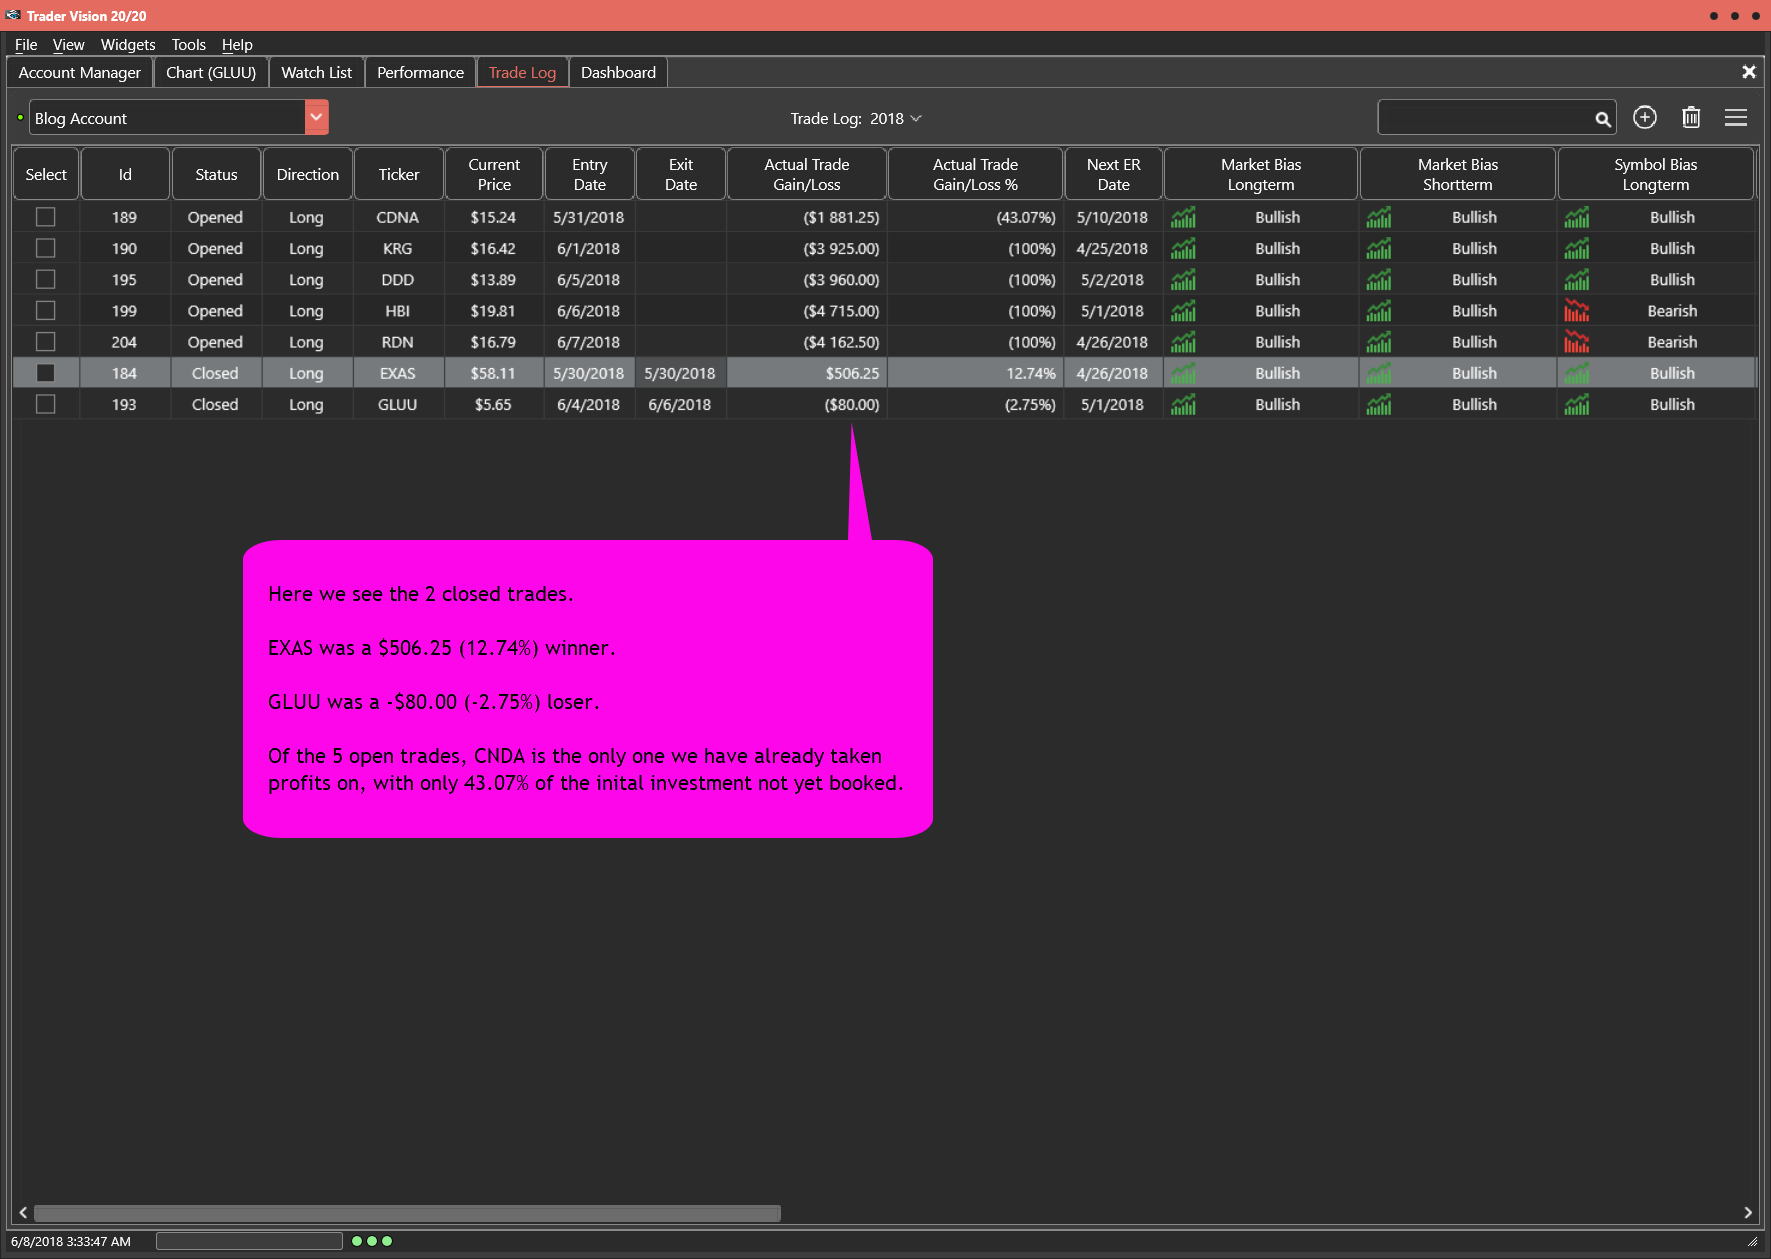
Note how Trader Vision 20/20 does so much of the work for you. All of your trades are logged, in incredible detail. This will allow you to analyze patterns in your trading, identifying problems and improving your performance. You’ll also be able to get back inside your own head even if you revisit the trade years later. Having all this information give you the ability to keep improving and reducing the emotional roller coaster that the amateurs face every day!
Sorry folks, I had a video crash and didn’t have time to re-record, render and post until Friday afternoon.
The good news is that we’ve made even more profit since the images above were taken (prior to Friday’s open).
[button_2 color=”light-green” align=”center” href=”https://youtu.be/ZJs7QmG9Wws” new_window=”Y”]Trade Review Video[/button_2]
If you’re interested in putting the power to Trader Vision 20/20 to work for you, click below.
[button_2 color=”orange” align=”center” href=”https://hitandruncandlesticks.com/product/trader-vision-20-20-monthly-subscription2/” new_window=”Y”]TV20/20 Software[/button_2]
Testimonial
This is not your usual service that sends out a ton of stock recommendations, and then cherry picks the winners to show you how great they are. Hit and Run Candlesticks and Right Way Options are truly educational services. They taught me how to trade not what to trade. The entire team: Rick, Doug, Steve, and Ed are there to help and answer your questions. They are awesome. They cut years off my learning curve. And it’s a team effort. Everyone in the room (all the members) are there to help with invaluable insights and advice. The only service you will ever need. Thanks to all the team for how you have helped me and for all you do. –Jonathan Bolnick
***************************************************************************************************
Investing and Trading involve significant financial risk and are not suitable for everyone. Ed Carter is not a licensed financial adviser nor does he offer trade recommendations or investment advice to anyone. No communication from Hit and Run Candlesticks Inc. is to be considered financial or trading advice. All information is intended for Educational Purposes Only. Terms of Service.
***************************************************************************************************