Trade War Strikes Again

Trade War Strikes Again

trade warIn yesterday’s blog and video, I made mention of the fact that nothing had changed in the so-called trade war and to be careful as we approached price resistance in the index charts.  Obviously, price action is not predictive of political speed bumps, but it did let us know prices were a bit overextended in the short-term.  I also mentioned yesterday the powerful emotion created by the “fear of missing out.”

We see the index ripping higher, and traders get that ugly feeling that you’re missing everything.  Even though the rally is well underway our vision becomes clouded by this strong emotion causing to chaise, and buy at or near price resistance.  Unfortunately, this bad habit is often quickly punished as the stock or the index pulls back, and you have to watch your capital disappear.  It’s a tough lesson to learn, and I hate to think about all the money I lost over the years as the market beat this lesson into my thick head.  A rule that has served me well is to sell stocks at or near price resistance, don’t buy at or near resistance.

Due to loss of power I will have to cut this short the blog short this morning as I’m running our of time.

Trade Wisely,

Doug

[button_2 color=”green” align=”center” href=”https://youtu.be/wWGuAivJUnQ”]Morning Market Prep Video[/button_2]
Be Patient Don’t Chase Benefits Of A Trend Workshop 7/26/18

[button_1 text=”Learn%20The%20Benefits%20Of%20A%20Trend” text_size=”32″ text_color=”#000000″ text_bold=”Y” text_letter_spacing=”0″ subtext_panel=”Y” subtext=”15%25%20Discount%20will%20end%20Friday%207%2F13%2F18″ subtext_size=”15″ subtext_color=”#ffffff” subtext_bold=”Y” subtext_letter_spacing=”0″ text_shadow_panel=”N” styling_width=”40″ styling_height=”30″ styling_border_color=”#000000″ styling_border_size=”1″ styling_border_radius=”6″ styling_border_opacity=”100″ styling_gradient_start_color=”#003bff” styling_gradient_end_color=”#003bff” drop_shadow_panel=”N” inset_shadow_panel=”N” align=”center” href=”https://ob124-e13140.pages.infusionsoft.net” new_window=”Y”/]


Be Patient Don’t Chase

Be patient and don’t chase (easier said than done for most traders). But more money and fewer loses are the likely outcomes. Trade patients are what today and maybe the next few days will be about, remember all the trading rules you have sworn to practice? This this the kind of day that requires those rules.

  1. Look for charts trending
  2. Look for profit taking to trend
  3. Look for support
  4. Look for a buying pattern

This is exactly what the team at Hit and Run Candlesticks/Right Way Options does. We can prove it works and we can back it up with our trades. Remember to keep trading as simple as possible and use common sense.

Past performance is not indicative of future returns

HRC Monthly Trading Results Right Here  Each, and every day we not only share trade ideas we also share how we plan to trade them. As of 7/10/18, our: “Road To Wealth” account is up 225%

MonthlyQuarterlySemi-AnnualAnnualPrivate 2-Hour Coaching

SPY 

Yesterday in the trading room I posted a poll to the members, the pol was: will the SPY close over $276.55 Friday? With the SPY’s last 3-day parabolic move to resistance and yesterday’s narrow range the probability was very high we would see a little profit-taking. A close below $276.55 would surely bring $275.35. The profit taking we will see the next day or two may be a good buying opportunity but wait for support and a buy signal. FYI we did take a VXX position yesterday.

VXX – Yesterday we took a trade on VXX on anticipation of an oversold bounce. If VXX can get through and hold $33.75 my plan would be a run for $34.85.

Members Login for what Rick is adding to his trade watch list Right Here

Focus Trading Education

Candlesticks • Price Action • T-Line • T-Line Bands • Support • Resistance • Trend • Trendlines • Chart Patterns • Buy Box • Volatility Stops • Profit Zones • Entry Zones • Protective Stops • RBB Rounded Bottom Breakout Strategy • Pop Out of The Box Strategy • Pinball Strategy • Trade Planning, Fibonacci, Stoch/RSI

To learn more about our trading tools join us in the trading room or consider Private Coaching.

Testimonial

This is not your usual service that sends out a ton of stock recommendations, and then cherry picks the winners to show you how great they are. Hit and Run Candlesticks and Right Way Options are truly educational services. They taught me how to trade not what to trade. The entire team: Rick, Doug, Steve, and Ed are there to help and answer your questions. They are awesome. They cut years off my learning curve. And it’s a team effort. Everyone in the room (all the members) are there to help with invaluable insights and advice. The only service you will ever need. Thanks to all the team for how you have helped me and for all you do. –Jonathan Bolnick

Rare to have a service teach you how they find their choices but, HRC/RWO teach you how to fish instead of fishing for you. And, your ideas are not panned but shared, implemented, or improved. Sharing is caring. –Thomas Bradly


Past performance is not indicative of future returns

Investing and Trading involve significant financial risk and is not suitable for everyone. No communication from Hit and Run Candlesticks Inc, Right Way Option, Trader Vision 2020 or Rick Saddler, Doug Campbell, Ed Carter, Steve Risner is to be considered financial or trading advice. All information is intended for Educational Purposes Only. Terms of Service.

Rick Saddler, Doug Campbell, Ed Carter, Steve Risner is not a licensed financial adviser nor do they offer trade recommendations or advice to anyone.


Public e_Learning 7-10-18

How to Dissect and Trade a Naked Chart

In this video, Doug Campbell discusses how to interpret and trade a “naked” chart.   The video covers topics ranging from Trend, Support and Resistance, being Patient and various tools you can use to help your trading.  Numerous charts are reviewed as current examples.

1 hour 38 minutes

Candlesticks • Price Action • T-Line • T-Line Bands • Support • Resistance • Trend • Trendlines • Chart Patterns • Buy Box • Volatility Stops • Profit Zones • Entry Zones • Protective Stops • RBB Rounded Bottom Breakout Strategy • Pop Out of The Box Strategy • Pinball Strategy • Trade Planning, Fibonacci, Stoch/RSI

[video_player type=”embed” style=”1″ dimensions=”custom” width=”640″ height=”480″ align=”center” margin_top=”0″ margin_bottom=”20″ ipad_color=”black”]PGlmcmFtZSBzcmM9Imh0dHBzOi8vcGxheWVyLnZpbWVvLmNvbS92aWRlby8yNzkzODIzNTEiIHdpZHRoPSI2NDAiIGhlaWdodD0iNDgwIiBmcmFtZWJvcmRlcj0iMCIgd2Via2l0YWxsb3dmdWxsc2NyZWVuPSIiIG1vemFsbG93ZnVsbHNjcmVlbj0iIiBhbGxvd2Z1bGxzY3JlZW49IiI+PC9pZnJhbWU+[/video_player]


Investing and Trading involve significant financial risk and are not suitable for everyone. No communication from Hit and Run Candlesticks or it’s associates should be considered as financial or trading advice. All information is intended for Educational Purposes Only. Terms of Service

[testimonials style=”8″ margin_top=”” margin_bottom=””][testimonial name=”Alan%20Helmstetter” company=”” href=””]%3Cp%3EI’ve%20been%20managing%20my%20own%20money%20for%20many%20years%20and%20have%20been%20interested%20and%20dabbled%20in%20trading%20stocks.%20I%20joined%20some%20services%20over%20the%20years%2C%20but%20none%20worked%20for%20me.%20I%20am%20getting%20closer%20to%20retirement%20and%20wanted%20to%20learn%20more%20about%20trading%20stocks%20as%20something%20to%20do%20in%20retirement%20and%20to%20supplement%20income.%20I%20learned%20all%20about%20candlesticks.%20Did%20much%20paper%20trading%20of%20stocks.%20Results%20were%20good%2Fbad%20and%20never%20got%20ahead.%20Came%20across%20a%20free%20HRC%20webinar%20and%20really%20liked%20the%20approach.%20Joined%20a%20month%20trial%20and%20also%20attended%20an%20RWO%20webinar.%20Decided%20to%20join%20RWO%20because%20of%20the%20options%20approach%20and%20have%20been%20a%20member%20for%20four%20months.%20Rick%20and%20Doug%20are%20the%20real%20deal.%20Both%20are%20amazing%20at%20reading%20charts%2Fprice%20as%20well%20as%20teaching%20their%20expertise.%20In%20the%20daily%20chatroom%20you%20will%20get%20potential%20trades%2C%20but%20more%20importantly%2C%20you%20will%20become%20part%20of%20a%20team%2C%20learn%20how%20to%20identify%20trades%20and%20even%20more%20importantly%20how%20to%20properly%20plan%20and%20manage%20trades.%20You%20know%20the%20adage%20–%20%22You%20give%20a%20man%20a%20fish%2C%20and%20you%20feed%20him%20for%20a%20day.%20You%20teach%20him%20to%20fish%2C%20and%20you%20give%20him%20an%20occupation%20that%20will%20feed%20him%20for%20a%20lifetime.%22%20%3Cstrong%3EGive%20them%20a%20try%20you%20will%20not%20regret%20it!%3C%2Fstrong%3E%3C%2Fp%3E%0A

[/testimonial][/testimonials]


ENPH Bullish Flag Breakout Price Action Rules

ENPH Bullish Flag Breakout

ENPH has drawn a bullish flag with a breakout. ENPH started to trend back in September of 2017 and is currently presenting a Trend With A Benefit. ENPH (looking at a 2-day chart) drew a bullish engulf followed be a bullish T-Line Run and then rested (Flag), yesterday price action (Daily chart) broke out of bullish engulf flag suggesting the buyers believe price can go higher. BOP is green for the BOP followers, and the V-Stop has gone flat for the past eight bars.

ENPH Bullish Flag Breakout

With 40% possible reward and a 5% risk, we believe ENPH with its bullish flag breakout is a candidate for our watchlist. Get the complete TV2020 trade plan right here

Past performance is not indicative of future returns

HRC Monthly Trading Results Right Here  Each, and every day we not only share trade ideas we also share how we plan to trade them. FYI as of yesterday, the account is up 220%

MonthlyQuarterlySemi-AnnualAnnualPrivate 2-Hour Coaching

[button_3 text=”reserve-your-spot.png” align=”center” href=”https://ob124-e13140.pages.infusionsoft.net” new_window=”Y”/] [button_2 color=”blue” align=”center” href=”https://ob124-e13140.pages.infusionsoft.net” new_window=”Y”]Extra 15% Discount Seats Are About Filled • Don’t Miss The Savings[/button_2]

SPY Bullish Price Action

Yes, that was bullish price action! Yesterday the SPY closed up $2.48 from Friday’s superb bullish day. The close yesterday ($277.90) should not be much of a surprise with a clear resistant level at $277.90. The Red White and Blue chart is now back in a bullish trend so bring on those benefits that come with a bullish trend. Keep your eye wide open I suspect trending benefits will be happening soon. Flags, Pennants, Triangles, wedges, J-Hooks, Pop Out Of The Box, and more.

VXX – According to the VXX chart, no fear is in sight, of course until there is fear.

Members Login for what Rick is adding to his trade watch list Right Here

Focus Trading Education

Candlesticks • Price Action • T-Line • T-Line Bands • Support • Resistance • Trend • Trendlines • Chart Patterns • Buy Box • Volatility Stops • Profit Zones • Entry Zones • Protective Stops • RBB Rounded Bottom Breakout Strategy • Pop Out of The Box Strategy • Pinball Strategy • Trade Planning, Fibonacci, Stoch/RSI

To learn more about our trading tools join us in the trading room or consider Private Coaching.

Testimonial

This is not your usual service that sends out a ton of stock recommendations, and then cherry picks the winners to show you how great they are. Hit and Run Candlesticks and Right Way Options are truly educational services. They taught me how to trade not what to trade. The entire team: Rick, Doug, Steve, and Ed are there to help and answer your questions. They are awesome. They cut years off my learning curve. And it’s a team effort. Everyone in the room (all the members) are there to help with invaluable insights and advice. The only service you will ever need. Thanks to all the team for how you have helped me and for all you do. –Jonathan Bolnick

Rare to have a service teach you how they find their choices but, HRC/RWO teach you how to fish instead of fishing for you. And, your ideas are not panned but shared, implemented, or improved. Sharing is caring. –Thomas Bradly


Past performance is not indicative of future returns

Investing and Trading involve significant financial risk and is not suitable for everyone. No communication from Hit and Run Candlesticks Inc, Right Way Option, Trader Vision 2020 or Rick Saddler, Doug Campbell, Ed Carter, Steve Risner is to be considered financial or trading advice. All information is intended for Educational Purposes Only. Terms of Service.

Rick Saddler, Doug Campbell, Ed Carter, Steve Risner is not a licensed financial adviser nor do they offer trade recommendations or advice to anyone.


Too much of a good thing?

Too much of a good thing?

Too much of a good thingIt’s always nice when we see the bulls step up and take charge breaking prices through resistance levels.  However, we can sometimes have too much of a good thing moving too far to fast.  I’m not suggesting that happened yesterday but, I do think its wise to consider the possibility.  That means I must stay focused and flexible being very careful not to by stocks near resistance levels and watching for signs of profit taking.

Let me be clear; the bulls are currently in control and the Futures suggest another bullish open is likely with the Dow gaping up more than 50 points.  I am only suggesting that you set your rose-colored glasses aside and stay focused.  Have a plan to protect your current profits and try to avoid chasing.  The fear of missing out is a powerful emotion, but if you chase a run already extended, you’re likely to experience a painful lesson.

On the Calendar

The JOLTS report is the only potential market-moving news on the Economic Calendar today.  At 10:00 AM forecasters expect a 6.700 million total jobs openings in June, showing incredible strength in labor demand.  For the first time in 20 years, there are more open positions than there are unemployed looking for work!  The NFIB Small Business Optimism Index @ 6:00 AM,  Readbood @ 8:55 AM and bond auctions at 11:30 AM & 1:00 PM to compleate the calendar day.

On the Earnings Calendar, PEP is one of the most notable of the 15 companies expected to report today.  With earnings season beginning soon make sure your checking when a company reports.  Failure to do so can be a costly mistake.

Action Plan

A big day for the bulls yesterday as buyers stepped in after the morning gap pushing all four of the major indexes higher.  Currently, the futures are pointing to a gap up open but be very careful not to chase.  In just 3-days the Dow has rallied more than 575 points, but T2122 is suggesting a reversal or consolidation could begin at any time.  Keep in mind after breaking above the 50-day average it’s pretty common for the Dow to test it as support.  I am certainly not predicting bearishness or that the market will absolutely reverse today.  I’m only pointing out the possibility.  If the bulls have enough juice, there is no reason they couldn’t extend this bull run.

Rather than chasing the run I will be more inclined to take some profits or use this bullishness to hedge positions by selling out of the money calls.  The QQQ and IWM will be very close to new record highs at the open, so it would not be out of the question to see a pause or even some profit taking.  Stay focused and flexible.

Trade Wisely.

Doug

[button_2 color=”green” align=”center” href=”https://youtu.be/GCO5Kf3qDOg”]Morning Market Prep Video[/button_2]
ENPH Setup and Trade Plan

Today’s Featured Trade Idea is ENPH.

You can read more about this trade in Rick’s blog post here.  Members can also see his detailed review in the trading room at 9:10am Eastern.  For now, here is my analysis and a potential trade plan made using our Trader Vision 20/20 software.

ENPH has been trending strongly Bullish for over a year. In the last month, it has been an even stronger bull. After a brief pullback, ENPH has printed a Bull Engulfing signal, consolidated and on Monday printed a Trader’s Best Friend signal.  I will enter above the Monday Close, using a very recent resistance level to protect a Stop placed at the bottom of Monday’s candle. Weekly S/R levels match up with 3 Fib Targets, but I will be counting only on the first of these.  The rest will be gravy.   Below is my markup of the chart and the trade plan as laid out by Trader Vision 20/20.  As a bonus, if you click the green button below, you’ll be able to watch a video of the chart markup and trade planning process.


The  ENPH Trade Setup – As of 7-9-18

ENPH as of 7-9-18


The Trade Plan

ENPH Plan for 7-10-18


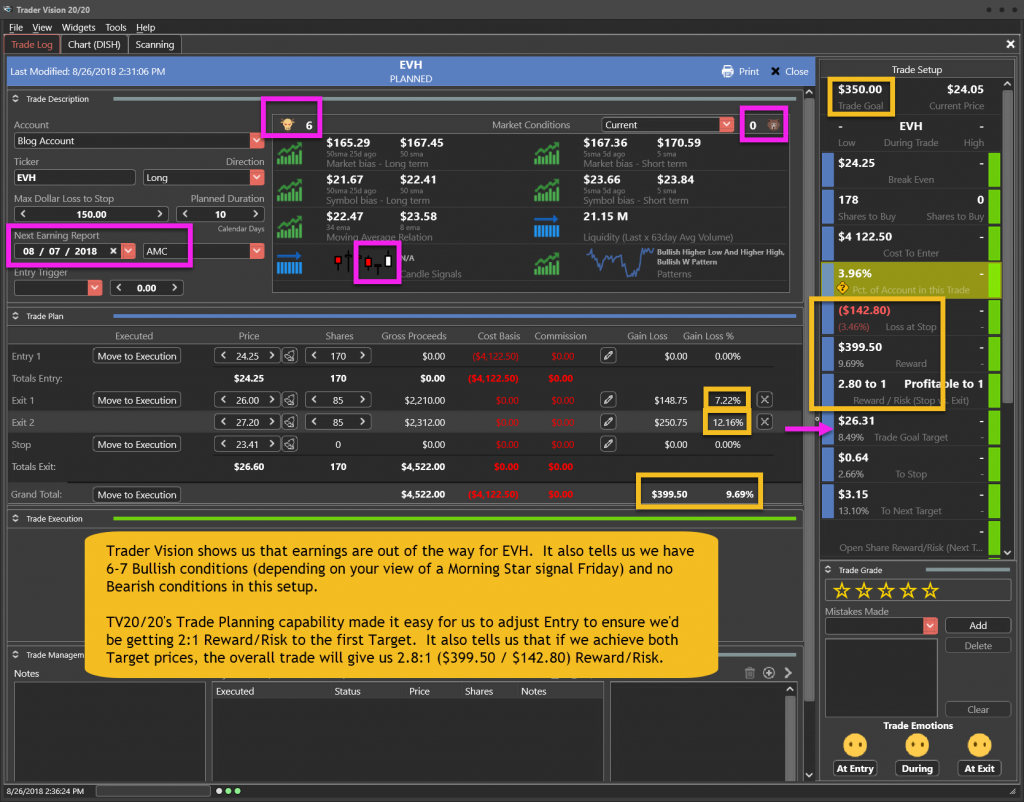
Note how Trader Vision 20/20 does so much of the work for you.  Knowing the overall risk of the position size, risk to Stop out and the Reward possible at each Target price can help a great deal with controlling our emotions.  Knowing the dollar impact of every scenario ahead of time, allows us to make calm decisions during the trade.  It really takes the pressure off.  No guesswork.  No surprises.  No emotional roller coaster.

To see a short video of this trade’s chart markup and trade planning, click the button below.


[button_2 color=”light-green” align=”center” href=”https://youtu.be/-IoY2pPMxmg” new_window=”Y”]Trade Plan Video[/button_2]


Put the power to Trader Vision 20/20 to work for you…

[button_2 color=”orange” align=”center” href=”https://hitandruncandlesticks.com/product/trader-vision-20-20-monthly-subscription2/” new_window=”Y”]TV20/20 Software[/button_2]


Testimonial

Trader Vision immediately simplified the process…immediately it provided that information and guidance to me. I knew what I would risk for how much reward, I began taking trades off at the 1st target, 2nd target, I was no longer holding all my trades for the homerun. I also began implementing the stop losses if and when they were reached, not just hoping the stock would recover.  It then became easier to see what patterns were working for me and which were not.  It provided a much more relaxed and stress-free environment. –Joan G


***************************************************************************************************

Investing and Trading involve significant financial risk and are not suitable for everyone. Ed Carter is not a licensed financial adviser nor does he offer trade recommendations or investment advice to anyone. No communication from Hit and Run Candlesticks Inc. is to be considered financial or trading advice. All information is intended for Educational Purposes Only. Terms of Service.

***************************************************************************************************

KR Setup and Trade Plan

Today’s Featured Trade Idea is KR.

You can read more about this trade in Rick’s blog post here.  Members can also see his detailed review in the trading room at 9:10am Eastern.  For now, here is my analysis and a potential trade plan made using our Trader Vision 20/20 software.

KR has been in a strong uptrend recently, completing a Golden Cross last month. It formed a Bull Flag, which bottomed out with a Morning Star signal and immediately followed that up with a Bull Engulfing type signal on Friday.  I will be looking for an Entry showing the Bulls are still in charge (a couple cents above Friday’s high) and looking for Support from the level broken Friday, with a Stop below Friday’s candle. Targets come from the Weekly chart Support/Resistance levels at $31.75 and $34.15.  Below is my markup of the chart and the trade plan as laid out by Trader Vision 20/20.  As a bonus, if you click the green button below, you’ll be able to watch a video of the chart markup and trade planning process.


The  KR Trade Setup – As of 7-6-18

KR Setup as of 7-6-18


The Trade Plan

KR Trade Plan for 7-9-18


Note how Trader Vision 20/20 does so much of the work for you.  Knowing the overall risk of the position size, risk to Stop out and the Reward possible at each Target can help a great deal with controlling our emotions.  Knowing the dollar impact of every scenario ahead of time, allows us to make calm decisions during the trade.  It really takes the pressure off.  No guesswork.  No surprises.  No emotional roller coaster.

To see a short video of this trade’s chart markup and trade planning, click the button below.


[button_2 color=”light-green” align=”center” href=”https://youtu.be/c18bf0BND64″ new_window=”Y”]Trade Plan Video[/button_2]


Put the power to Trader Vision 20/20 to work for you…

[button_2 color=”orange” align=”center” href=”https://hitandruncandlesticks.com/product/trader-vision-20-20-monthly-subscription2/” new_window=”Y”]TV20/20 Software[/button_2]


Testimonial

Trader Vision immediately simplified the process…immediately it provided that information and guidance to me. I knew what I would risk for how much reward, I began taking trades off at the 1st target, 2nd target, I was no longer holding all my trades for the homerun. I also began implementing the stop losses if and when they were reached, not just hoping the stock would recover.  It then became easier to see what patterns were working for me and which were not.  It provided a much more relaxed and stress-free environment. –Joan G


***************************************************************************************************

Investing and Trading involve significant financial risk and are not suitable for everyone. Ed Carter is not a licensed financial adviser nor does he offer trade recommendations or investment advice to anyone. No communication from Hit and Run Candlesticks Inc. is to be considered financial or trading advice. All information is intended for Educational Purposes Only. Terms of Service.

***************************************************************************************************