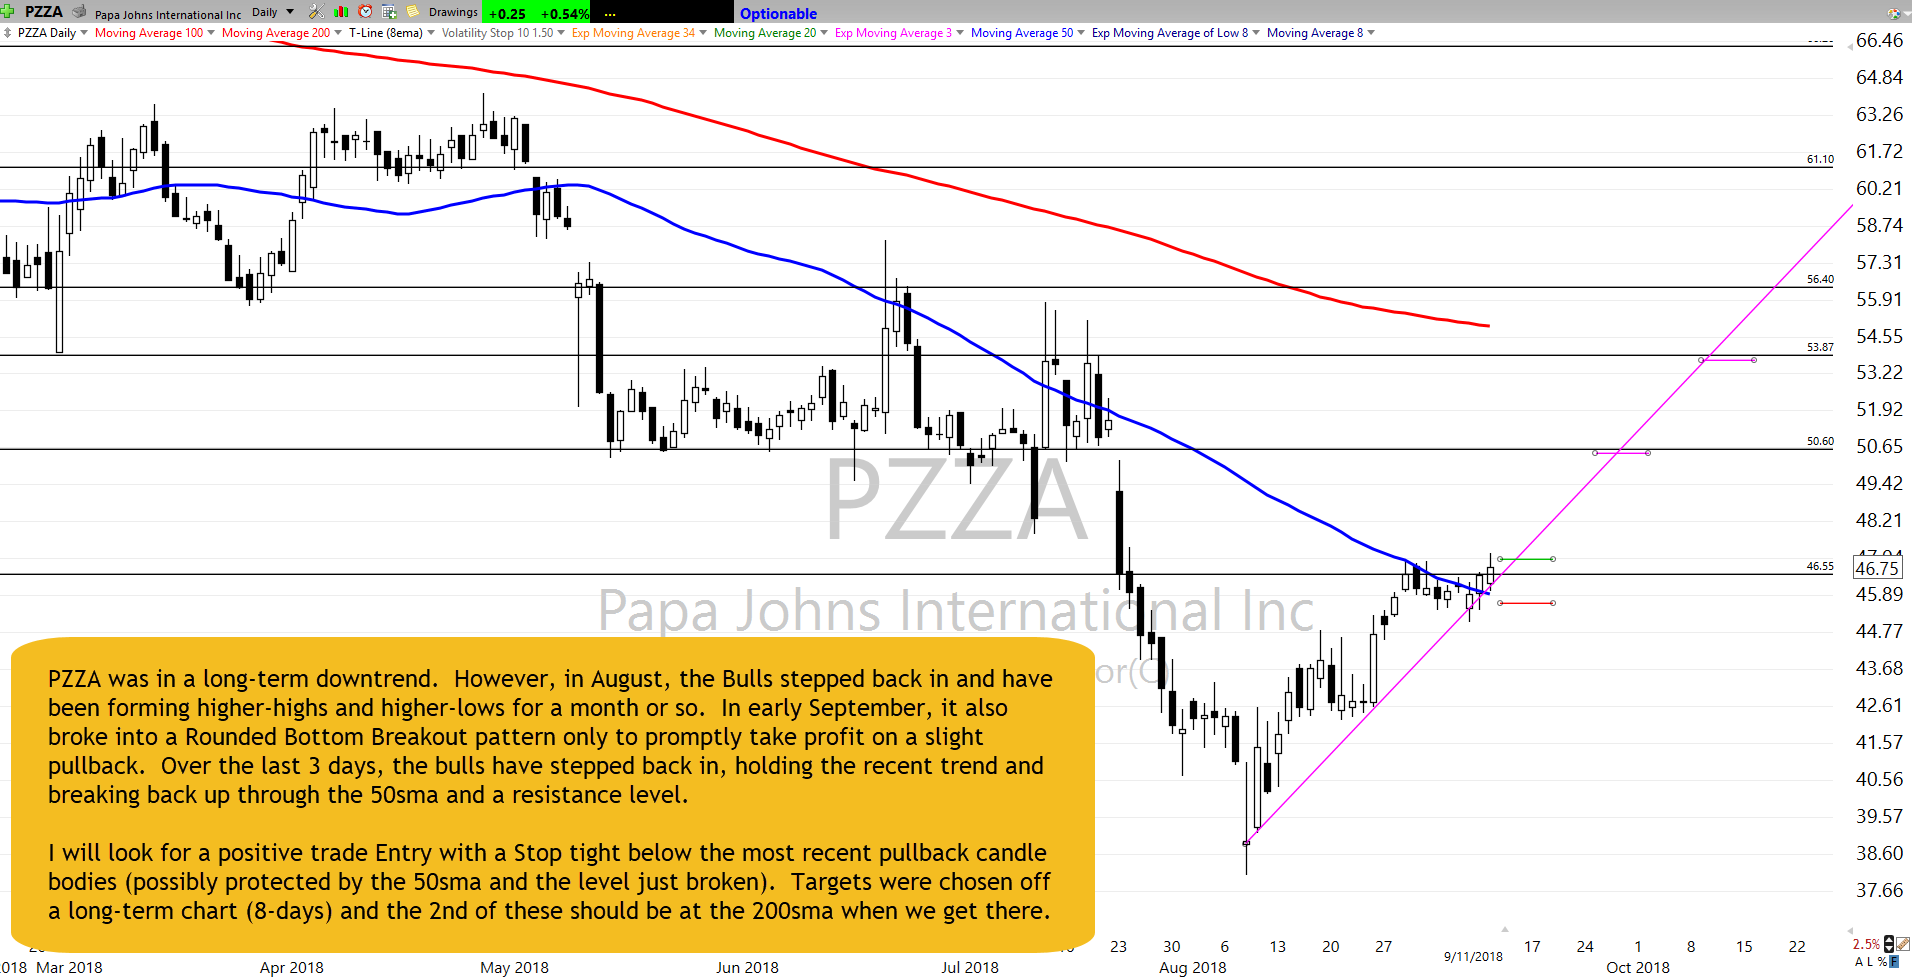
EVH Setup and Trade Plan

Today’s Featured Trade Idea is EVH.

Here are my analysis and a potential trade plan made using our Trader Vision 20/20 software.

EVH has been in a Bullish Trend since the last quarter of 2017. In the last month, it has made another leg higher and has tightly consolidated over the last 8-9 days. (We might even call it a Pop-Out-of-the-Box setup.) Then on Friday, it printed a Morning Star type signal.

I will look for a b/o Entry (above the box), using the box as protection for my Stop tight below. Target prices were defined off longer-term charts and confirmed by Fib. Extensions of the August rally run.

Trader Vision shows us that earnings are out of the way for EVH. It also tells us we have 6-7 Bullish conditions (depending on your view of a Morning Star signal Friday) and no Bearish conditions in this setup.

TV20/20’s Trade Planning capability made it easy for us to adjust Entry to ensure we’d be getting 2:1 Reward/Risk to the first Target. It also tells us that if we achieve both Target prices, the overall trade will give us 2.8:1 ($399.50 / $142.80) Reward/Risk.

Having this knowledge before a trade is even entered makes it much easier to control emotions and maintain discipline.

Below is my markup of the chart and the trade plan as laid out by Trader Vision 20/20.  As a bonus, if you click the green button below, you’ll be able to watch a video of the chart markup and trade planning process.

The EVH Trade Setup – As of 8-24-18

EVH Chart Setup as of 8-24-18

The Trade Plan

EVH Trade Plan for 8-27-18

Note how Trader Vision 20/20 does so much of the work for you.  Knowing the ratio of Bullish Conditions to Bearish ones as well as the overall risk of the position size, risk to Stop out and the Reward possible at each Target price can help a great deal with controlling our emotions.  Knowing the dollar impact of every scenario ahead of time, allows us to make calm decisions during the trade.  It really takes the pressure off.  No guesswork.  No surprises.  No emotional roller coaster.

To see a short video of this trade’s chart markup and trade planning, click the button below.


[button_2 color=”light-green” align=”center” href=”https://youtu.be/VYXuu_hw1OE” new_window=”Y”]Trade Plan Video[/button_2]

Put the power to Trader Vision 20/20 to work for you…

[button_2 color=”orange” align=”center” href=”https://hitandruncandlesticks.com/product/trader-vision-20-20-monthly-subscription2/” new_window=”Y”]TV20/20 Software[/button_2]


Testimonial

Trader Vision immediately simplified the process…immediately it provided that information and guidance to me. I knew what I would risk for how much reward, I began taking trades off at the 1st target, 2nd target, I was no longer holding all my trades for the homerun. I also began implementing the stop losses if and when they were reached, not just hoping the stock would recover.  It then became easier to see what patterns were working for me and which were not.  It provided a much more relaxed and stress-free environment. –Joan G


***************************************************************************************************

Investing and Trading involve significant financial risk and are not suitable for everyone. Ed Carter is not a licensed financial adviser nor does he offer trade recommendations or investment advice to anyone. No communication from Hit and Run Candlesticks Inc. is to be considered financial or trading advice. All information is intended for Educational Purposes Only. Terms of Service.

***************************************************************************************************

HSC Setup and Trade Plan

Today’s Featured Trade Idea is HSC.

Here are my analysis and a potential trade plan made using our Trader Vision 20/20 software.

HSC has been a Bullish trend since February. In recent months, it has formed a Bullish Inverted Head and Shoulders pattern. As the last part of this, it has now also broken out of a J-hook pattern at the Inv. H&S neckline.

I do recognize that it has been running bullish for 6 days in a row and may need more rest before continuing. So it may not be a Friday trade as much as a soon trade.  I will look for another potential rest day and buy a b/o if it holds the neckline as Support.  The stop is not far below that Support and Targets are at levels where Fib. Ext. align with 5-8day chart S/R levels.

Trader Vision tells us earnings are out of the way and we have over 2mo. until the next round. It also shows us this Chart offers 5 Bullish Conditions and no Bearish conditions, making for a nice long Setup.

TV20/20 also shows us that this Trade Plan can achieve our goals. It gives us a 2.2:1 Reward/Risk at Target #1, 3.1:1 at Target 2 and if we reach the 3rd Target we would end up with a trade that gives us over 3.8:1 ($411.50 / $108). So the plan is solid.

Having this knowledge before a trade is even entered makes it much easier to control emotions and maintain discipline.

Below is my markup of the chart and the trade plan as laid out by Trader Vision 20/20.  As a bonus, if you click the green button below, you’ll be able to watch a video of the chart markup and trade planning process.

The HSC Trade Setup – As of 8-23-18

HSC Chart Setup as of 8-23-18

The Trade Plan

HSC Trade Plan for 8-24-18

Note how Trader Vision 20/20 does so much of the work for you.  Knowing the ratio of Bullish Conditions to Bearish ones as well as the overall risk of the position size, risk to Stop out and the Reward possible at each Target price can help a great deal with controlling our emotions.  Knowing the dollar impact of every scenario ahead of time, allows us to make calm decisions during the trade.  It really takes the pressure off.  No guesswork.  No surprises.  No emotional roller coaster.

To see a short video of this trade’s chart markup and trade planning, click the button below.


[button_2 color=”light-green” align=”center” href=”https://youtu.be/q0PkYl8JG_E” new_window=”Y”]Trade Plan Video[/button_2]


Put the power to Trader Vision 20/20 to work for you…

[button_2 color=”orange” align=”center” href=”https://hitandruncandlesticks.com/product/trader-vision-20-20-monthly-subscription2/” new_window=”Y”]TV20/20 Software[/button_2]


Testimonial

Trader Vision immediately simplified the process…immediately it provided that information and guidance to me. I knew what I would risk for how much reward, I began taking trades off at the 1st target, 2nd target, I was no longer holding all my trades for the homerun. I also began implementing the stop losses if and when they were reached, not just hoping the stock would recover.  It then became easier to see what patterns were working for me and which were not.  It provided a much more relaxed and stress-free environment. –Joan G


***************************************************************************************************

Investing and Trading involve significant financial risk and are not suitable for everyone. Ed Carter is not a licensed financial adviser nor does he offer trade recommendations or investment advice to anyone. No communication from Hit and Run Candlesticks Inc. is to be considered financial or trading advice. All information is intended for Educational Purposes Only. Terms of Service.

***************************************************************************************************

Defending Support

Defending Support

Defending SupportAlthough the price action yesterday was challenged by a nasty whipsaw the Bulls did a good job of defending support levels.  This morning it would seem the Bulls have gathered some reinforcements and are looking to challenge the January high in the SPY.  The SPY has been pounding on that door all week, and just maybe the Bulls can break it down today.

As you know, I like going to the bank on Friday.  The expected gap up may be just the reason I need to take some profits and reduce my weekend risk.  Stay focused on price action because market highs can produce head fakes and whipsaws.  A morning gap into resistance is a perfect setup for both so set aside your bias and be ready to react if that happens to occur.  Personally, my hope is for a breakout and run higher.  Unfortunately, I can’t pay my bills with hope.

On the Calendar

We kick off this Friday on the Economic Calendar at 8:30 AM with the Durable Good Orders.  Consensus suggests an increase of 0.5 percent with core capital goods also up 0.5 percent.  After that, we have a Fed Speaker @ 10:00 AM and the Baker-Hughes Rig Count at 1:00 PM.  Also, keep in mind there will likely be a slew of news reports from the Jackson Hole Symposium.

On the Earnings Calendar, we have a very light day with under 20 earnings reports.  Most notable would be FL, BKE, HIBB and UBNT all reporting before the bell today.

Action Plan

After a day of choppy price action and nasty whipsaw, the Bulls seemed to gather some energy overnight.  With apparently no concern for rising tariffs Asian market closed mostly higher.  European markets are higher across the board and look to finish this week on a positive note.  Consequently, the US futures are pointing to a bullish open with the Dow expected to gap more than 50 points higher.

Perhaps today is the day when the SPY breaks out to and new record high joining IWM.  That’s my hope, however, once again we have to watch carefully for the possibility of head fakes and whipsaws.  Remember volumes continue to be low, and the news will be bursting with reports out of Jackson Hole.  Remember today is a great day to put some profits in your account and a gap up morning may be just what the doctor ordered to make that possible.  Have an awesome weekend.

Trade Wisely,

Doug

[button_2 color=”green” align=”center” href=”https://youtu.be/ypeCaDgyvbw”]Morning Market Prep Video[/button_2]

PBO T-Line Bullish Engulf bullish above $63.75 with a stop around $62.20

PBO T-Line Bullish Engulf

ZEN has drawn us a picture of a Pull Back Opportunity (PBO) to the T-Line with a Bullish Engulf. ZEN has been in a strong trend until June-July, then gapped. After the gad the consolidation started with mild selling around the T-Line to the 34-EMA, this is what we call the (PBO). Yester, the Bullish Engulf, is suggesting the buyers could be getting ready to challenge the recent high and run higher. I am bullish on the chart and buy bullish above $63.75 with a stop around $62.20

Trading Tip – Some days are about protecting profits, not making more profits.

Trading Tip – Daily, 2-3 and 5-day charts give important clues.

Trading Tip – Sell or trim profits off as price reaches important levels.

Past performance is not indicative of future returns

Good Trading, Rick, and Trading Team

This link takes you to a project account that Rick started so members and students could see how it works Monthly Trading Results updated the first week of each month.

What is Rick is adding to his trade watchlist today? A 246% plus increase in 7 months can’t be all wrong.

[button_1 text=”Futures%20Trading%20Room%20and%20Membership” text_size=”32″ text_color=”#000000″ text_bold=”Y” text_letter_spacing=”0″ subtext_panel=”Y” subtext=”Annual%20Discount%2063%25%20Ends%20Soon” subtext_size=”20″ subtext_color=”#ffffff” subtext_bold=”Y” subtext_letter_spacing=”0″ text_shadow_panel=”N” styling_width=”40″ styling_height=”30″ styling_border_color=”#000000″ styling_border_size=”1″ styling_border_radius=”6″ styling_border_opacity=”100″ styling_gradient_start_color=”#0064ff” styling_gradient_end_color=”#0064ff” drop_shadow_panel=”N” inset_shadow_panel=”N” align=”center” href=”https://hitandruncandlesticks.com/top-gun-futures/” new_window=”Y”/]

____________________________________________________________

SPY • Struggling with 2018 High

Boring and uneventful day yesterday. The SPY is struggling with the 2018 highs and seems very stubbern when comes to letting the sellers in the house. Bottom line is price needs hold above the T-Line and breakout. If the sellers can close us below the T-Line this will set the stage for a test of the 34-EMA again.

T-Line • Traders Best Friend

Five-day T-Line Run, the question is will today make six?

****VXX – Closing below the T-Line is telling us the fear is not growing, the price action of the last three days is telling us the fear is trying to stir.

Focus Trading Education

Candlesticks • Price Action • T-Line • T-Line Bands • Support • Resistance • Trend • Trendlines • Chart Patterns • Buy Box • Volatility Stops • Profit Zones • Entry Zones • Protective Stops • RBB Rounded Bottom Breakout Strategy • Pop Out of The Box Strategy • Pinball Strategy • Trade Planning, Fibonacci, Stoch/RSI

Subscription PlansPrivate 2-Hour Coaching

Testimonial

This is not your usual service that sends out a ton of stock recommendations, and then cherry picks the winners to show you how great they are. Hit and Run Candlesticks and Right Way Options are truly educational services. They taught me how to trade not what to trade. The entire team: Rick, Doug, Steve, and Ed are there to help and answer your questions. They are awesome. They cut years off my learning curve. And it’s a team effort. Everyone in the room (all the members) are there to help with invaluable insights and advice. The only service you will ever need. Thanks to all the team for how you have helped me and for all you do. –Jonathan Bolnick

Rare to have a service teach you how they find their choices but, HRC/RWO teach you how to fish instead of fishing for you. And, your ideas are not panned but shared, implemented, or improved. Sharing is caring. –Thomas Bradly


Past performance is not indicative of future returns

Investing and Trading involve significant financial risk and is not suitable for everyone. No communication from Hit and Run Candlesticks Inc, Right Way Option, Trader Vision 2020, Top Gun Futures or Rick Saddler, Doug Campbell, Ed Carter, Steve Risner is to be considered financial or trading advice. All information is intended for Educational Purposes Only. Terms of Service.

Rick Saddler, Doug Campbell, Ed Carter, Steve Risner is not a licensed financial adviser nor do they offer trade recommendations or advice to anyone.


Looking for Inspiration

Looking for Inspiration

Looking for InspirationAnother day passes with the market looking for inspiration.  We saw the Bulls at work in the QQQ and IWM yesterday with Bears winning the day in DIA and the opposing sides about equally in the SPY.  Overall trends are still bullish as this battle at resistance has yet to reveal a clear directional conviction.  Asian markets closed mixed and European markets currently lean slightly bearish.  Surprisingly the Dow Futures are currently a flat open even as the US and China raise tariffs by another 16-billion.

With the bullish trends still intact, I remain cautiously optimistic but recognize the fact that at any time as bulls and bears battle near resistance that either side could easily gain control.  So as they continue to look for inspiration, I must also be careful not to over trade and closely watch price action for clues.  The old phrase, “hurry up and wait,” seems very appropriate for the current market condition.

On the Calendar

The Jackson Hole Economic Symposium begins today which will likely create a significant number of headlines that could have some market effect.  Weekly Jobless Claims will kick off the Economic Calendar at 8:30 AM which consensus expects a small increase to 215,000.  At 10:00 AM we will get the latest reading on New Home Sales which are expecting a solid increase to 649,000 vs. 631,000 in June.  The Natural Gas Report @ 10;30 AM and the Fed Balance Sheet @ 4:30 indicated as potential market-moving but unless there is a major surprise it’s unlikely.

On the Earnings Calendar, we have nearly 50 companies expected to report results.  Before the bell, we will hear from BABA & HRL with SDSK, GPS, INTU and ROST reporting after the close.

Action Plan

The Bulls showed some tenacity yesterday especially in the QQQs and the IWM indexes.  The SPY made another attempt to break through to record highs however finished the day just below.  The Bears were the most active in Dow with the index slipping 88 points to test the March high as support.  Durning the night futures were slightly weak but once again have managed to rally, currently indicating a flat to slightly bullish open.

All and all the Bulls have maintained control even with lighter than average volume.  With 16-billion in new US tariffs and Beijing immediate retaliation of 16-billion, I’m surprised the market is shrugging it off as if nothing happened.  Once again I would suggest traders use a little caution as we dance around record highs.  Big moves up or down are possible as we consolidate near resistance.  Also, remember head fakes and whipsaws are common near market highs so stay focused on price and plan your risk carefully.

Trade Wisely,

Doug

[button_2 color=”green” align=”center” href=”https://youtu.be/Uy7Xse4nZjw”]Morning Market Prep Video[/button_2]

Bullish “W” Pattern Started Party ASNA • Bullish Above $4.85 • stop $4.65

Bullish “W” Pattern Started Party

In mid-July, ASNA started a Bullish W Pattern that Started the party that has lead ASNA to break out of the $4.60 level. ASNA is in a 16-day T-Line Run that has broken out of resistance. Now, 5-days of testing support and the T-Line and we now have a bullish Morning Star on the 2-day chart. The weekly chart should also be mentioned, a Bullish Rounded Bottom Breakout – J-Hook Continuation Pattern breaking the Dotted Duece.

Trading Tip – Daily, 2-3 and 5-day charts give important clues.

Trading Tip – Sell or trim profits off as price reaches important levels.

Past performance is not indicative of future returns

Good Trading, Rick, and Trading Team

This link takes you to a project account that Rick started so members and students could see how it works Monthly Trading Results updated the first week of each month.

What is Rick is adding to his trade watchlist today? A 246% plus increase in 7 months can’t be all wrong.

____________________________________________________________

SPY • Indecisive

I would say yesterday’s close in the SPY was a little indecisive with a Doji testing the 2018 highs and being up 4 bars with higher highs and lows. The bullish wall of worry can be testing to all of us. I have found focusing on what price action for the last 2-3- days and what it’s doing in relationship with the T-Line is better than purely focusing on the current candle. If the T-Line is trending up and price makes me nervous, it is usually just noise within a range. The $286.40 area stoped price for now, and we should see a little consolidation.

T-Line • Traders Best Friend

It’s crazy how well the T-Line works with a price. It does lag with the price but moves close enough to keep a swing trader in the trend or pattern. I find following price and the T-Line together helps to keep me away from the hard right edge. The hard right edge puts thoughts in your head that will make you crazy.

****VXX – Closed with a Doji/Bullish Engulf yesterday, a relief rally is likely. We did buy a little yesterday around $28.90

Focus Trading Education

Candlesticks • Price Action • T-Line • T-Line Bands • Support • Resistance • Trend • Trendlines • Chart Patterns • Buy Box • Volatility Stops • Profit Zones • Entry Zones • Protective Stops • RBB Rounded Bottom Breakout Strategy • Pop Out of The Box Strategy • Pinball Strategy • Trade Planning, Fibonacci, Stoch/RSI

Subscription PlansPrivate 2-Hour Coaching

Testimonial

This is not your usual service that sends out a ton of stock recommendations, and then cherry picks the winners to show you how great they are. Hit and Run Candlesticks and Right Way Options are truly educational services. They taught me how to trade not what to trade. The entire team: Rick, Doug, Steve, and Ed are there to help and answer your questions. They are awesome. They cut years off my learning curve. And it’s a team effort. Everyone in the room (all the members) are there to help with invaluable insights and advice. The only service you will ever need. Thanks to all the team for how you have helped me and for all you do. –Jonathan Bolnick

Rare to have a service teach you how they find their choices but, HRC/RWO teach you how to fish instead of fishing for you. And, your ideas are not panned but shared, implemented, or improved. Sharing is caring. –Thomas Bradly


Past performance is not indicative of future returns

Investing and Trading involve significant financial risk and is not suitable for everyone. No communication from Hit and Run Candlesticks Inc, Right Way Option, Trader Vision 2020 or Rick Saddler, Doug Campbell, Ed Carter, Steve Risner is to be considered financial or trading advice. All information is intended for Educational Purposes Only. Terms of Service.

Rick Saddler, Doug Campbell, Ed Carter, Steve Risner is not a licensed financial adviser nor do they offer trade recommendations or advice to anyone.


ASNA Setup and Trade Plan

Today’s Featured Trade Idea is ASNA.

Members can hear Rick’s detailed review in the trading room at 9:10am Eastern.  For now, here is my analysis and a potential trade plan made using our Trader Vision 20/20 software.

ASNA has been in a bullish trend since late March and over the last month made another strong push higher. In the last week it has taken profits on in a shallow pullback/consolidation that is marked by the number of Doji (indecision) about the selling.

On Tuesday it printed a Trader’s Best Friend signal and is right at the recent highs. I will be looking for a b/o Entry using a line across the Doji bodies as support to protect a Stop. My Targets will be up where Weekly S/R levels match well to Fib. Ext.

Trader Vision shows us this ticker has 6 Bullish conditions and no Bearish conditions. A check of NASDAQ tells us earnings should not be until 9/24. So this Chart should have time to work and is a very favorable setup.

TV20/20 does the math for us, which allowed us quickly review and analyze multiple scenarios. In this case we added a 3rd Target to the trade. However, we have the comfort of knowing that if we only reach the 1st Target, we can sell the entire position there and still easily make our Trade Goal.

Having this knowledge before a trade is even entered makes it much easier to control emotions and maintain discipline.

Below is my markup of the chart and the trade plan as laid out by Trader Vision 20/20.  As a bonus, if you click the green button below, you’ll be able to watch a video of the chart markup and trade planning process.

The ASNA Trade Setup – As of 8-21-18

ASNA Chart Setup as of 8-21-18

The Trade Plan

ASNA Trade Plan for 8-22-18

Note how Trader Vision 20/20 does so much of the work for you.  Knowing the ratio of Bullish Conditions to Bearish ones as well as the overall risk of the position size, risk to Stop out and the Reward possible at each Target price can help a great deal with controlling our emotions.  Knowing the dollar impact of every scenario ahead of time, allows us to make calm decisions during the trade.  It really takes the pressure off.  No guesswork.  No surprises.  No emotional roller coaster.

To see a short video of this trade’s chart markup and trade planning, click the button below.


[button_2 color=”light-green” align=”center” href=”https://youtu.be/mMa-T7SwxRE” new_window=”Y”]Trade Plan Video[/button_2]


Put the power to Trader Vision 20/20 to work for you…

[button_2 color=”orange” align=”center” href=”https://hitandruncandlesticks.com/product/trader-vision-20-20-monthly-subscription2/” new_window=”Y”]TV20/20 Software[/button_2]


Testimonial

Trader Vision immediately simplified the process…immediately it provided that information and guidance to me. I knew what I would risk for how much reward, I began taking trades off at the 1st target, 2nd target, I was no longer holding all my trades for the homerun. I also began implementing the stop losses if and when they were reached, not just hoping the stock would recover.  It then became easier to see what patterns were working for me and which were not.  It provided a much more relaxed and stress-free environment. –Joan G


***************************************************************************************************

Investing and Trading involve significant financial risk and are not suitable for everyone. Ed Carter is not a licensed financial adviser nor does he offer trade recommendations or investment advice to anyone. No communication from Hit and Run Candlesticks Inc. is to be considered financial or trading advice. All information is intended for Educational Purposes Only. Terms of Service.

***************************************************************************************************

Stalemate at Resistance

Stalemate at Resistance

StalemateAs the Bull worked to push the markets higher yesterday, the Bears battled them to a stalemate at price resistance.  Unfortunately, they left behind the potential topping candle patterns on the DIA, SPY, and QQQ.  At resistance, the Shooting Star Candle Pattern should give a little pause and raise our caution levels.  However, a single candle pattern is only a very short-term clue.  To increase the importance of a shooting star pattern, it must follow-through with bearish price action.

As a result, there is reason for traders to approach the market this morning with a little caution but no need to run for the hills in panic.  After such a strong rally where the Dow has gained nearly 850 points from last Wednesday’s low a simple consolidation at the highs is certainly possible.  Give price resistance respect and stay focused on price action.  If you can lock in some profits to reduce risk and be careful not to load up on new risk because a stalemate can shift directions very quickly.

On the Calendar

We have had it easy so far this week, but today on the Economic Calendar we have three potential market-moving reports.  At 10:00 AM forecasters expect Existing Home Sales to increase to 5.420 million in July.  Then at 10:30 AM we will get the result of the unforecast EIA Petroleum Status Report.  Last but not least the FOMC will release their minutes from their last meeting at 2:00 PM.

On the Earnings Calendar, we have a slightly lighter day, but some name reports that could move the market.  Before the bell LOW, TGT & MOMO report with JBSS, HTHT & LB fessing up after today’s market close.

Action Plan

The Bulls managed to rally yesterday setting a new record high close for IWM.  The SPY ran up and printed a new record but unfortunately was unable to hold on to it by the closing bell.  Shooting star candle patterns were left behind in the DIA, SPY, and QQQ as Bears worked to defend resistance levels.  Futures which were down more than 100 points during the evening hours have recovered substantially now indicating a flat open.

I think it would be wise to exercise a little caution this morning with the battle at resistance in full swing.  Keep in mind with the FOMC minutes released at 2:00 PM we could see the light choppy price after the morning rush as the market waits.

Trade Wisely,

Doug

[button_2 color=”green” align=”center” href=”https://youtu.be/E4VpUG09Spk”]Morning Market Prep Video[/button_2]